IPI’s Data Lab aims to leverage data science into IPI’s areas of policy research. Using techniques like data mining, visualization, and machine learning, the Data Lab will help drive new insights on how the multilateral and local actors can approach complex crises and vulnerabilities related to lack of peace, security, stability, development, and health. While the use of new digital technologies to help understand and address transnational risks is growing, there is still a wide gap between the insights generated by these technologies and the decision makers that would benefit most from their use, both at international and national level.
IPI projects that used the Data Lab include:
IPI Peacekeeping Database
This project involves data mining PDF documents released by DPKO, converting them to structured data, and incorporating them into a database covering who gave how many personnel to which missions on a monthly basis from 1990-present. The project resides on the Providing for Peacekeeping website, created by IPI’s Peacekeeping and Data Lab teams. The data is updated monthly and also generates a number of up-to-date graphics, as well as a map to visualize the geographic the distribution of contributions. An initial paper was published by IPI observing some basic trends in peacekeeping contributions over time. Future research plans include testing theories of why countries contribute to peacekeeping and network analysis of who contributes to specific missions as well as expanding the database to include other aspects of peacekeeping contributions.
Compliance with UN Security Council Resolutions Addressing Civil Wars
IPI’s Security Council Compliance project tests which factors influence compliance of warring parties to the UN Security Council’s demands issued in resolutions to civil wars from 1989 to 2003. The project has developed the a methodology to determine the level of compliance of those addressed by the Council and created a dataset with more than 1,000,000 data points to look for corealtions. Indicators under consideration include:
– characteristics of the civil war addressed by the demand;
– contextual activities of the United Nations related to the conflict;
– circumstances of the drafting and adoption of the resolution containing the demand;
– substance of the resolution and of the demand;
– characteristics of the demand addressees; and
– follow-up, monitoring, and enforcement mechanisms.
The results of the initial research on the correlates of compliance will be published in a forthcoming IPI report.
Data maps and graphs
These interfaces show various trends and characteristics of compliance with Security Council resolutions in civil wars from 1989 to 2003.
**Please note that many of the graphs presented here double as filters, so feel free to navigate to whatever subset of data you’re interested in. If you find yourself lost and need to reset the page, you can find a reset button at the bottom of the page that looks like this:  .
.
 |
The Compliance Map gives the user a geographic navigation interface. The heat map can also be used to filter specific country cases and mousing over a country gives specific details of compliance and the Council’s activities. Additional filters control the time frame on view as well as limiting to specific resolutions. | |
 |
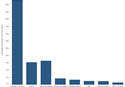
The Trends in Compliance shows trends in compliance over time. The main chart gives the average compliance score per resolution as well as a trend line that appears as a dashed red line. The pie charts show the aggregate breakdown of compliance and depth of demand scores as well as the percentage of demands that request parties to engage in behavior agreed to in prior peace agreements (our proxy for resolutions that reinforce existing peace processes). Finally, at the lower right, there is a breakdown of conflict intensity leading up to the demand. | |
 |
The Carrots and Sticks shows the breakdown of demands that include sanctions, incentives, and threats on the right side of the page. On the left side of the page, we map out the breakdown of monitoring mechanism used by the Security Council to gauge compliance. | |
 |
The Field Presence shows the number of demands that are adopted in the presence of various types of field presence. Additionally, we show the correlation to peacekeeping force sized (both UN and non-UN) and compliance. At the bottom right, we show a breakdown of the types of thematic requests contained in Security Council demands. |
Overlapping Crises
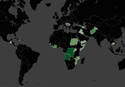
The overlapping crises map is an interactive world map that streams data from the World Bank, UNDP, WHO, FAO, and Transparency International, to visualize the most extreme cases of vulnerabilities like youth bulge, poverty, inequality, lack of education, poor public health, corruption, and food and water scarcity. Users can overlap layers of various crises to get a sense of the challenges facing each country. The map is updated as new data become available.
Catalogue of Indices
From human rights to conflict, from governance to gender, many organizations have invested in developing statistical models that derive data from multiple sources and rank countries according to their score, and using them to measure changes in countries across different policy areas is increasing. IPI’s Data Lab provides the first list of country indices available in open-sources. It reviews thirty indices and provides a description of the methodology and results. The indices are organized in six categories: 1) Conflict, Fragility, and Instability 2) Environment 3) Freedoms and Rights 4) Gender 5) Governance 6) Socio-Economics. In addition, the Data Lab has prepared an interactive world map that shows data from all thirty different indices. Users can also see results from combined indices in different thematic categories.
Machine Learning and Conflict Prediction
This project is IPI’s first attempt at aggregating global subnational vulnerability indicators to be used for the application of machine learning predictive algorithms. The initial run aggregates a number of sources of satellite derived, national governance and geographical data to the district level. A subset of this data (continental Africa) was then used to apply a predictive algorithm of conflict for a feasibility and performance test. The outcome was highly feasible but not particularly predictive (25% variance explained) due to constraints with test data. Future iterations will focus on making data collection and aggregation more efficient and increasing the data used for performance gains. The results write-up will be published in a forthcoming article for Stability Journal.
How to Build Peace Database
The Build Peace Database aims to document uses of information, communications, networking and gaming technologies in peacebuilding programs around the world. It is a collaborative project of YoLab, the International Peace Institute, the Human Data and Development Initiative, and Mercy Corps, and is curated by Helena Puig Larrauri and Michaela Ledesma.