The charts generated here are based on data in the PPP database. Click to view these by topic: Number of Active Years, Financial Contributions, Troop Contributions, Women in Peacekeeping, Neighboring Country Contributions to Missions, Francophone Contributions to Missions in Francophone Countries, and UN Recruitment Processes.
Number of Active Years
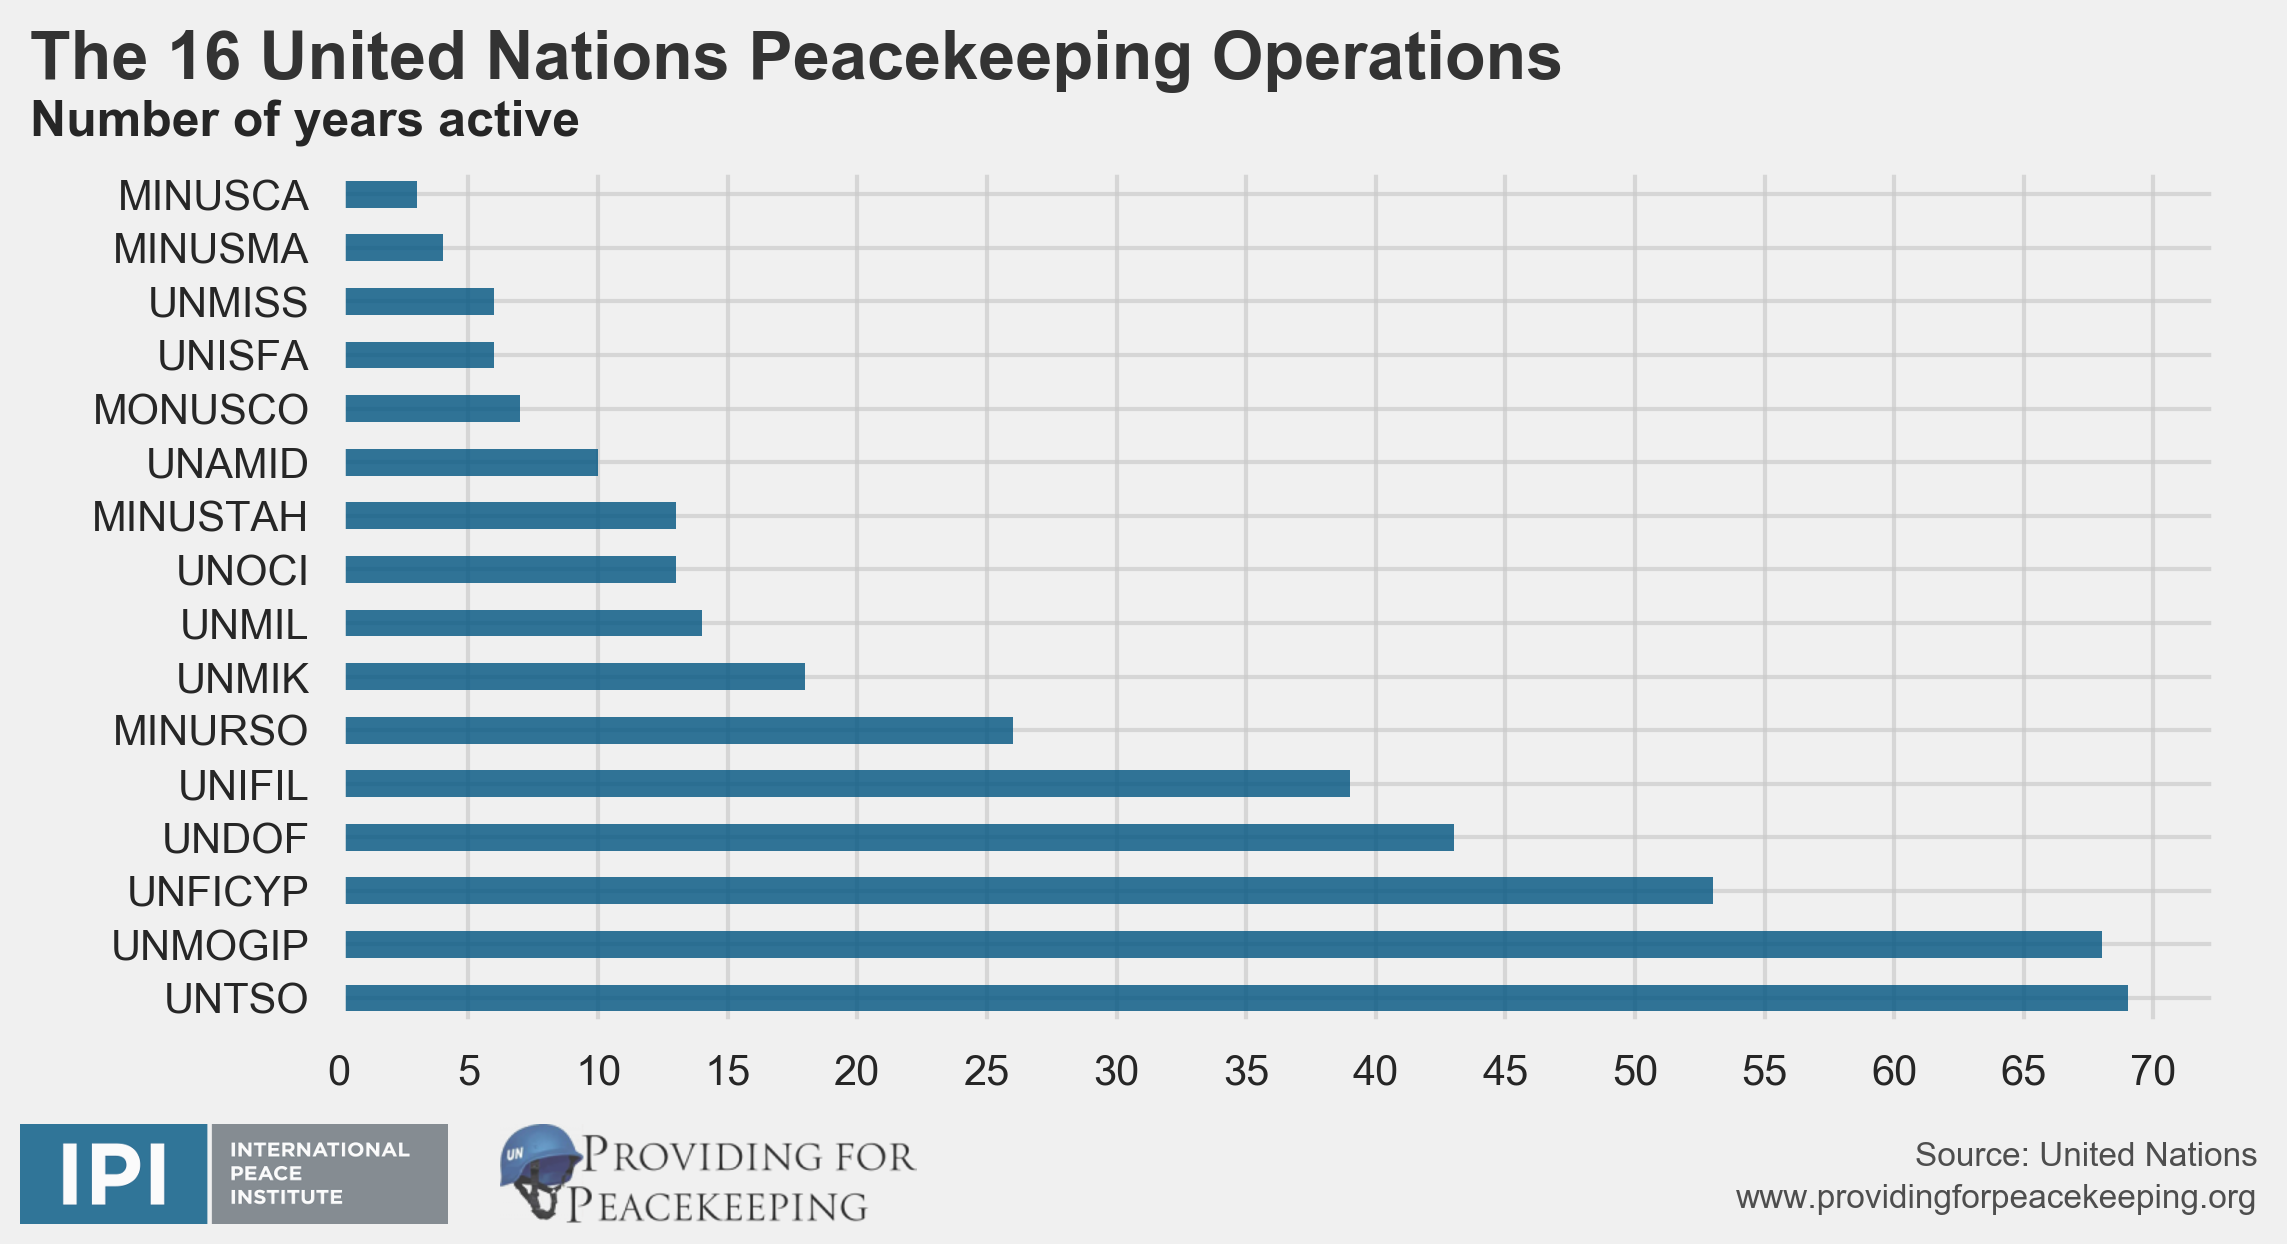
Number of years the 16 current UN peacekeeping operations have been active
This graphs shows the extreme differences in length of UN peacekeeping operations. Length of missions is becoming of extreme relevance as 2017 sees the draw-down of three UN peacekeeping operations- Haiti, Liberia and Cote d’Ivoire. It is also the year of mission evaluation where long time missions such as Kosovo and Cyprus may see some changes as the UN re-considers the issue of exit strategies.
Financial Contributions
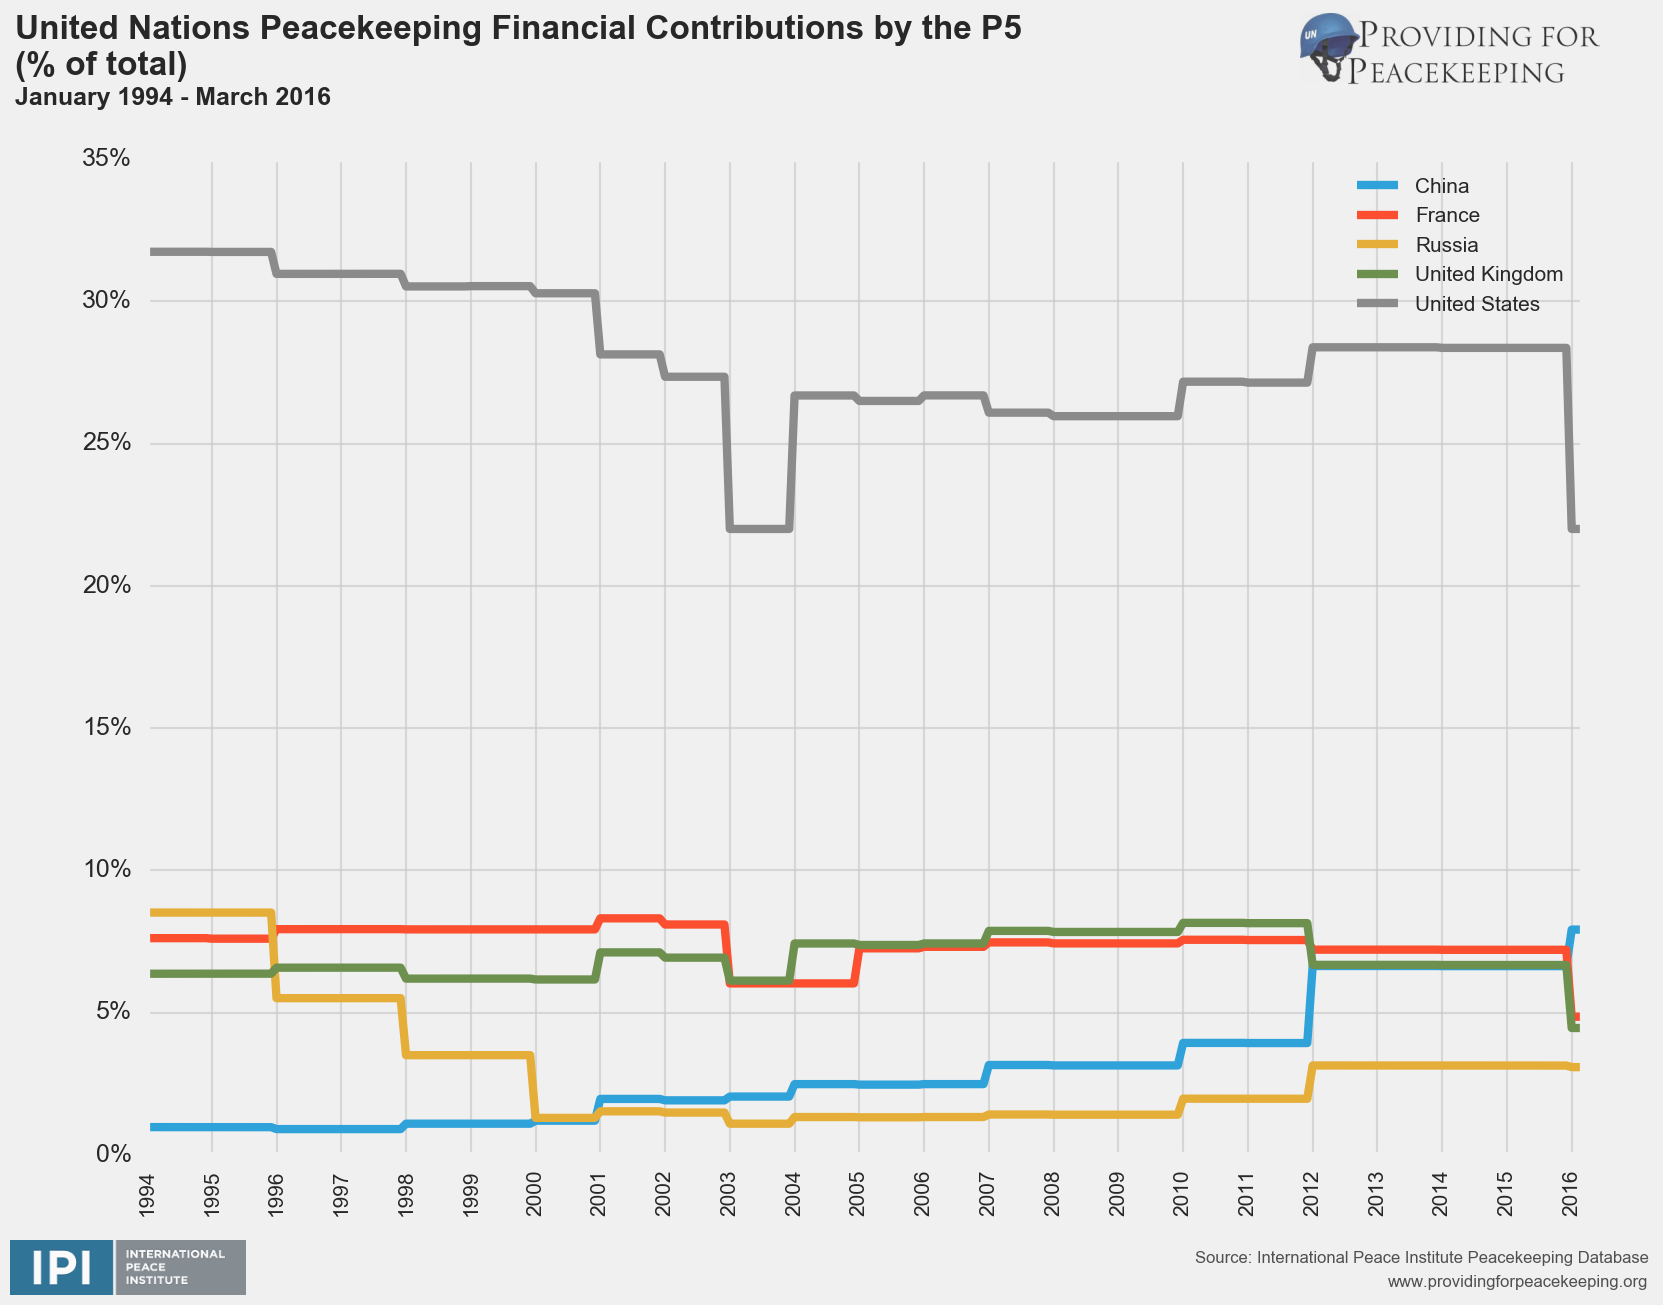
UN Peacekeeping Financial Contributions by the P5 (% of total) (January 1994 – March 2016)
This graphic shows the financial contributions of the P5 as percentages from January 1994 – December 2016. Notably, the USA contributes vastly more than any other member of the P5.
|
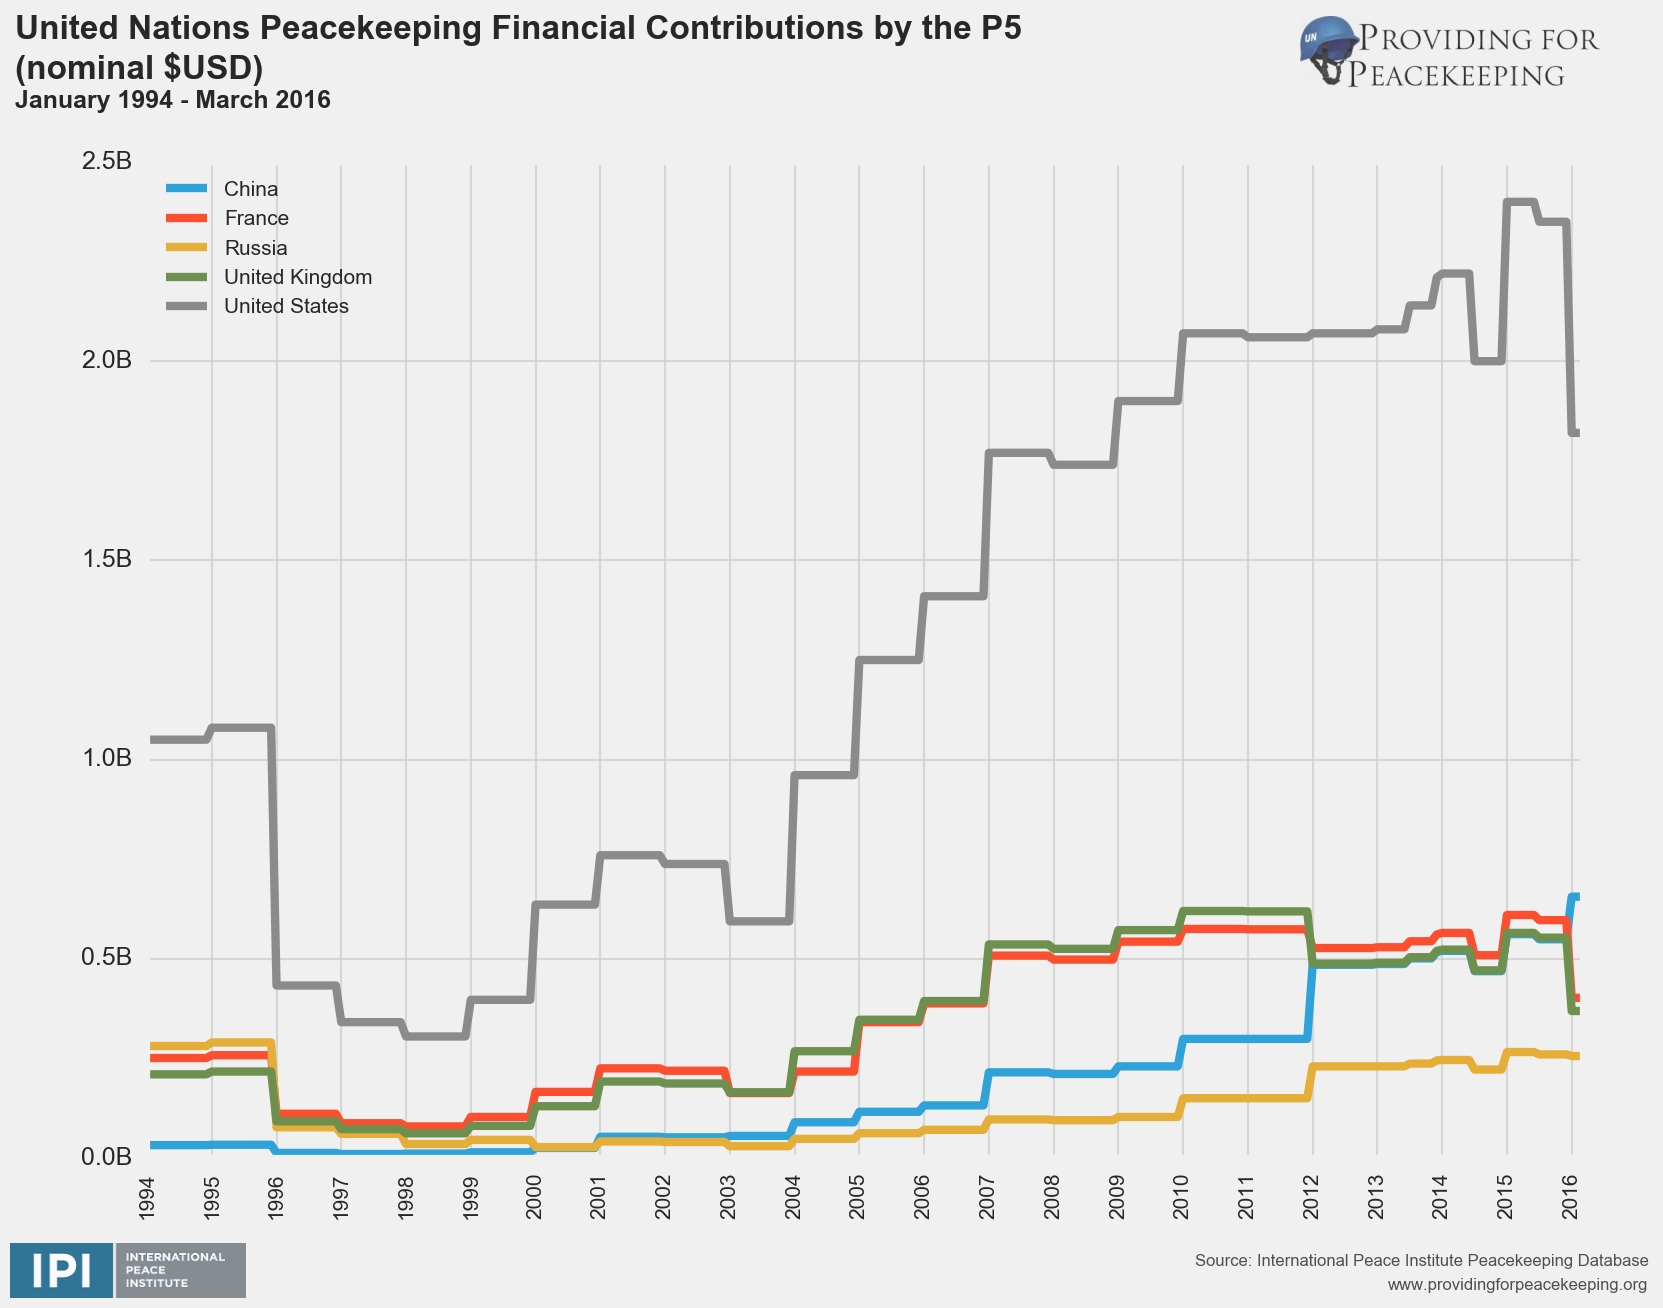
UN Peacekeeping Financial Contributions by the P5 (nominal $ USD) (January 1994 – March 2016)
This graphic shows the financial contributions of the P5 as a nominal amount from January 1994 – December 2016. Once again, the USA, contributes vastly more than any other member of the P5.
|
Troop Contributions
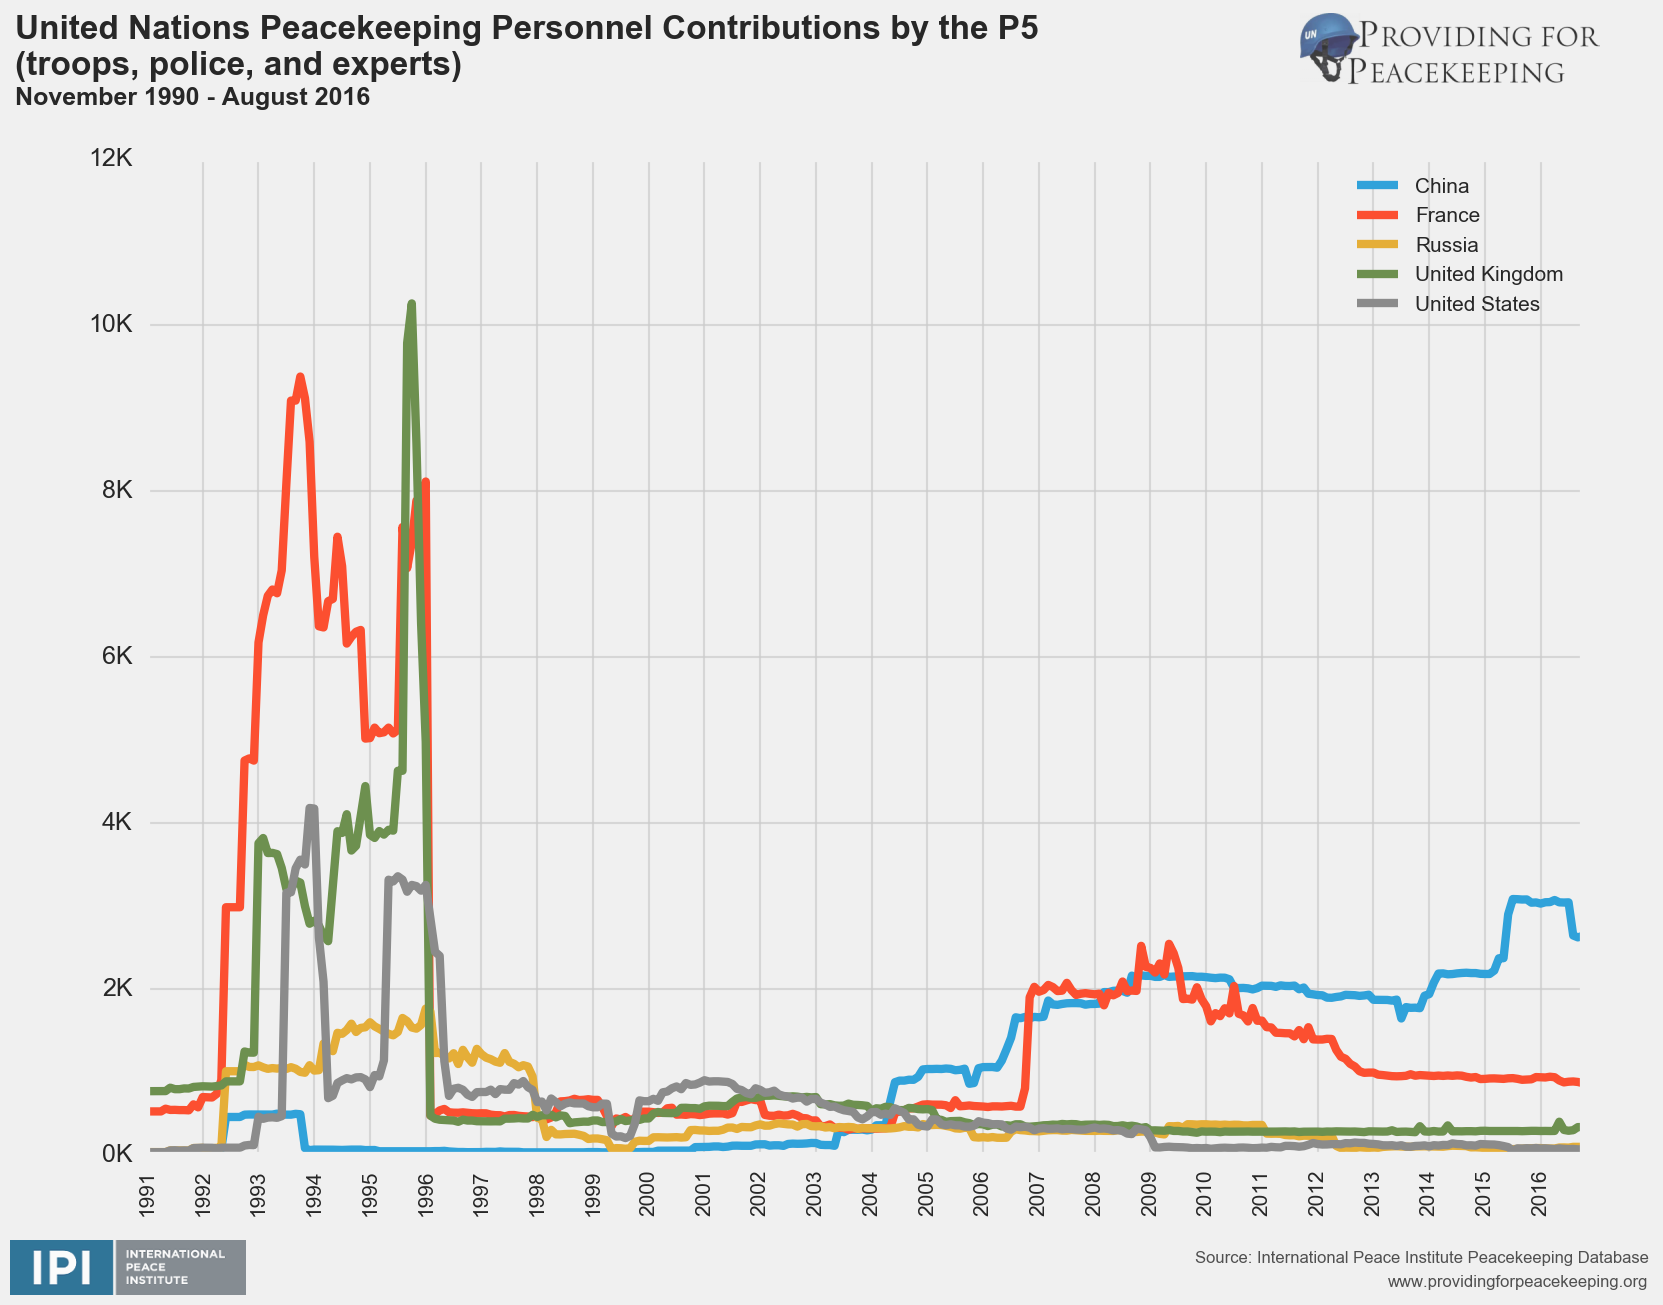
UN Peacekeeping Personnel Contributions by the P5 (November 1990 – August 2017)
This graphic shows the troop contributions of the P5 to UN Peacekeeping Missions, specifically troops, police and experts. Notably, the USA is one of the lowest troop contributors.
|
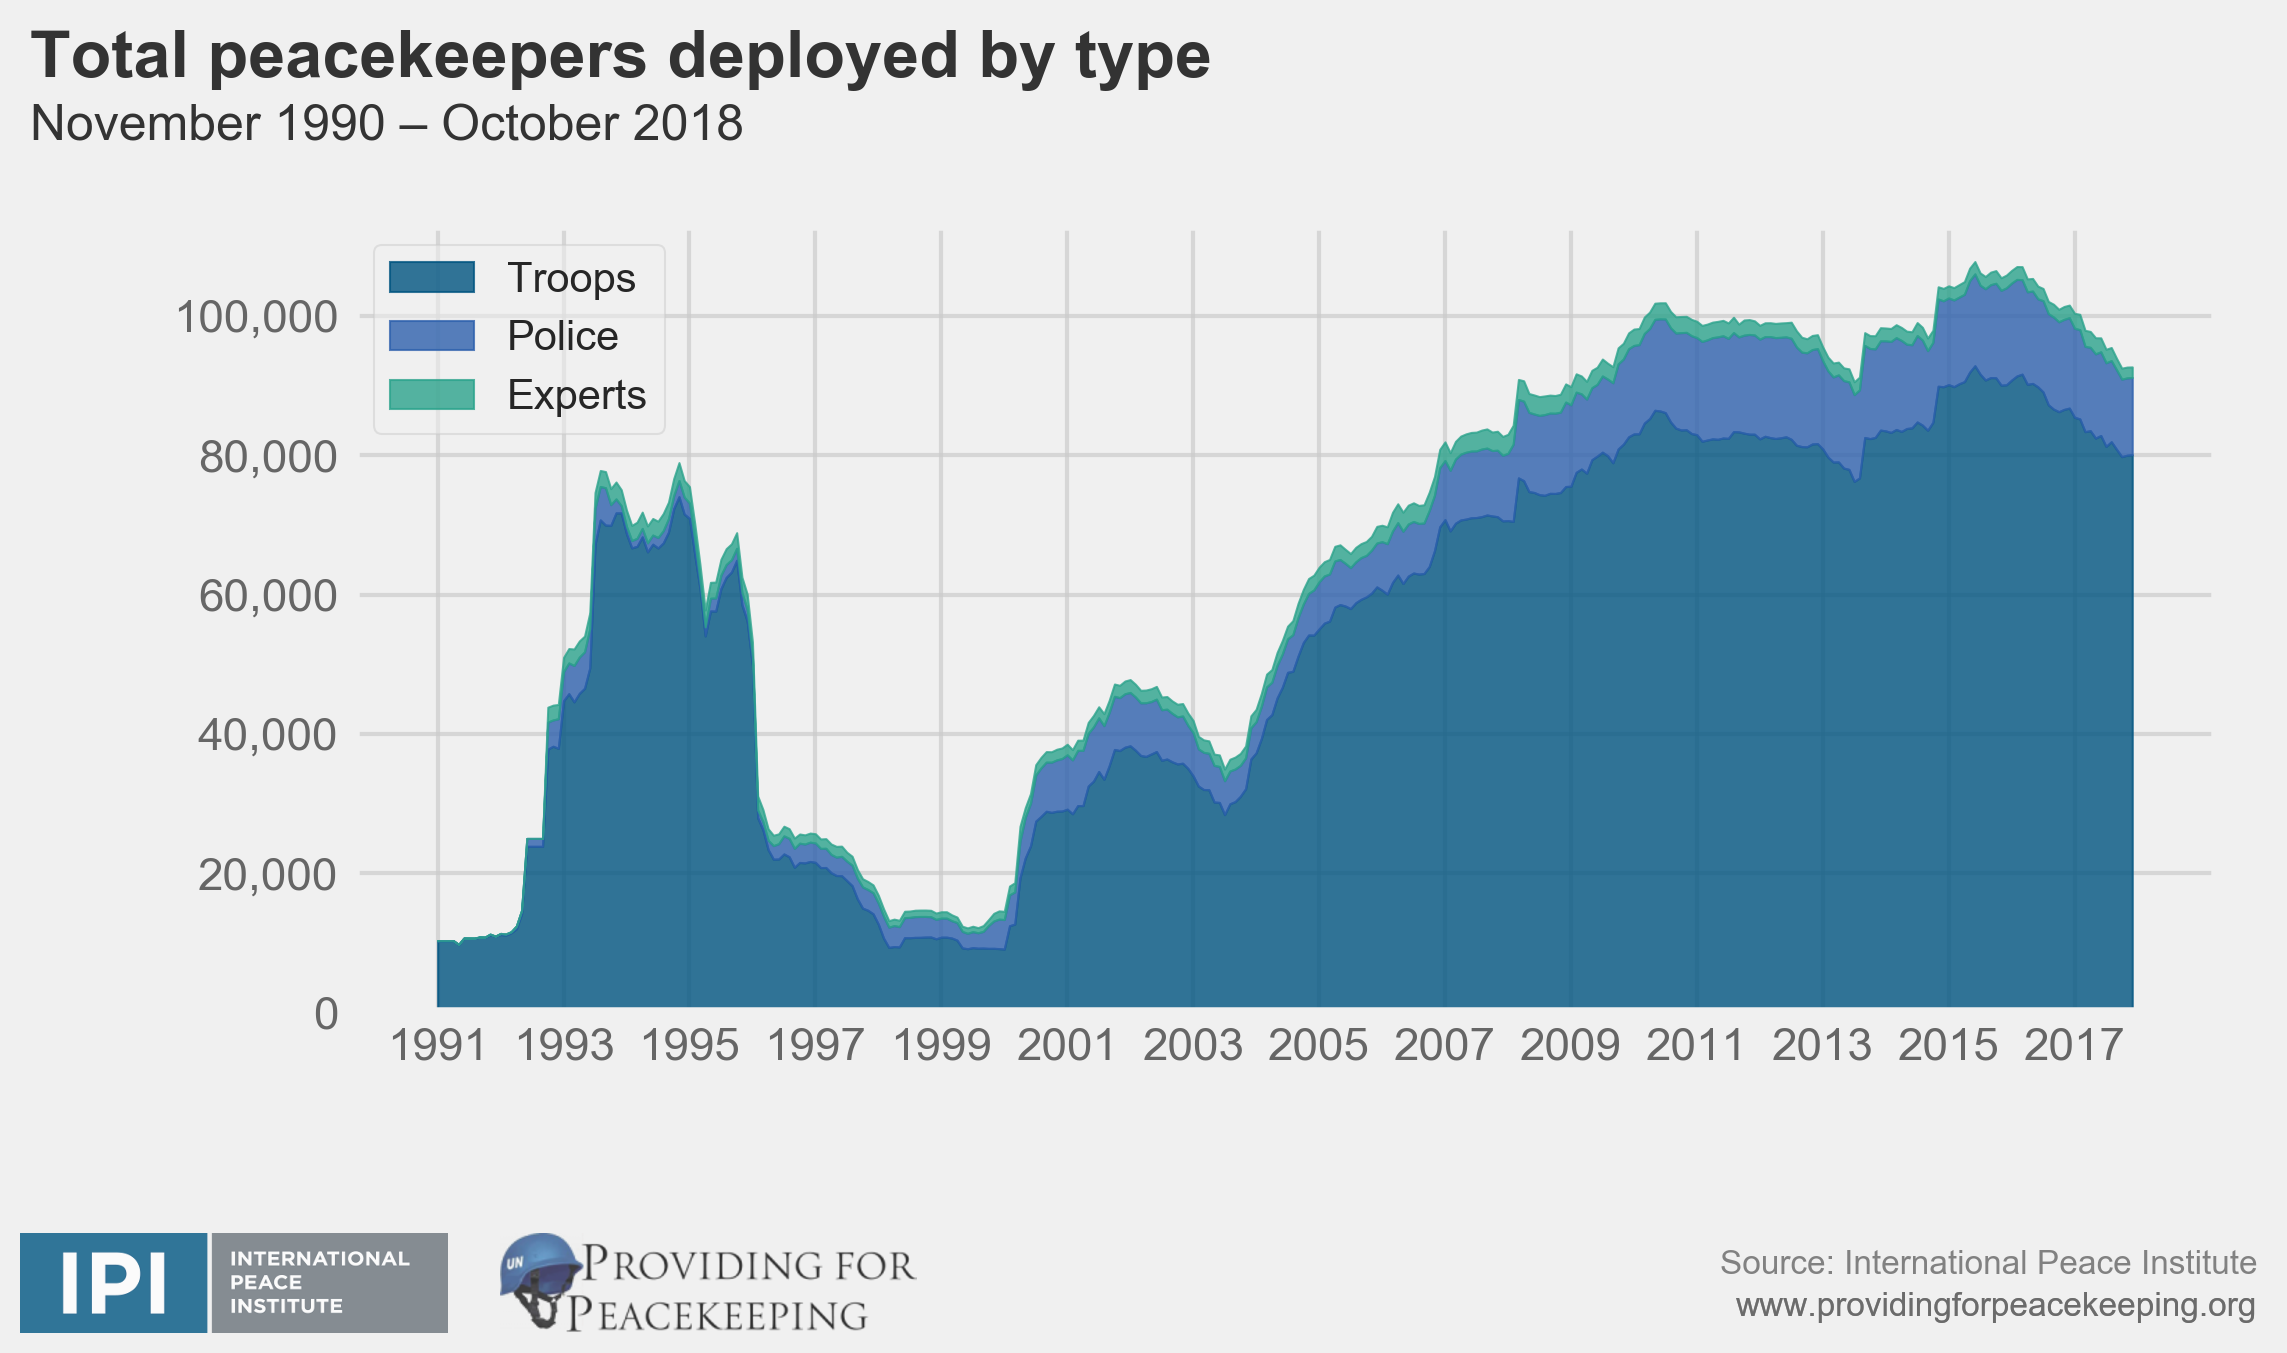
Total Number of Uniformed Peacekeepers Deployed by Type (November 1990 – October 2018)
This graph shows total uniformed peacekeepers deployed to UN peacekeeping missions between January 1990 and December 2016. The three types are troops, police and observers.
|
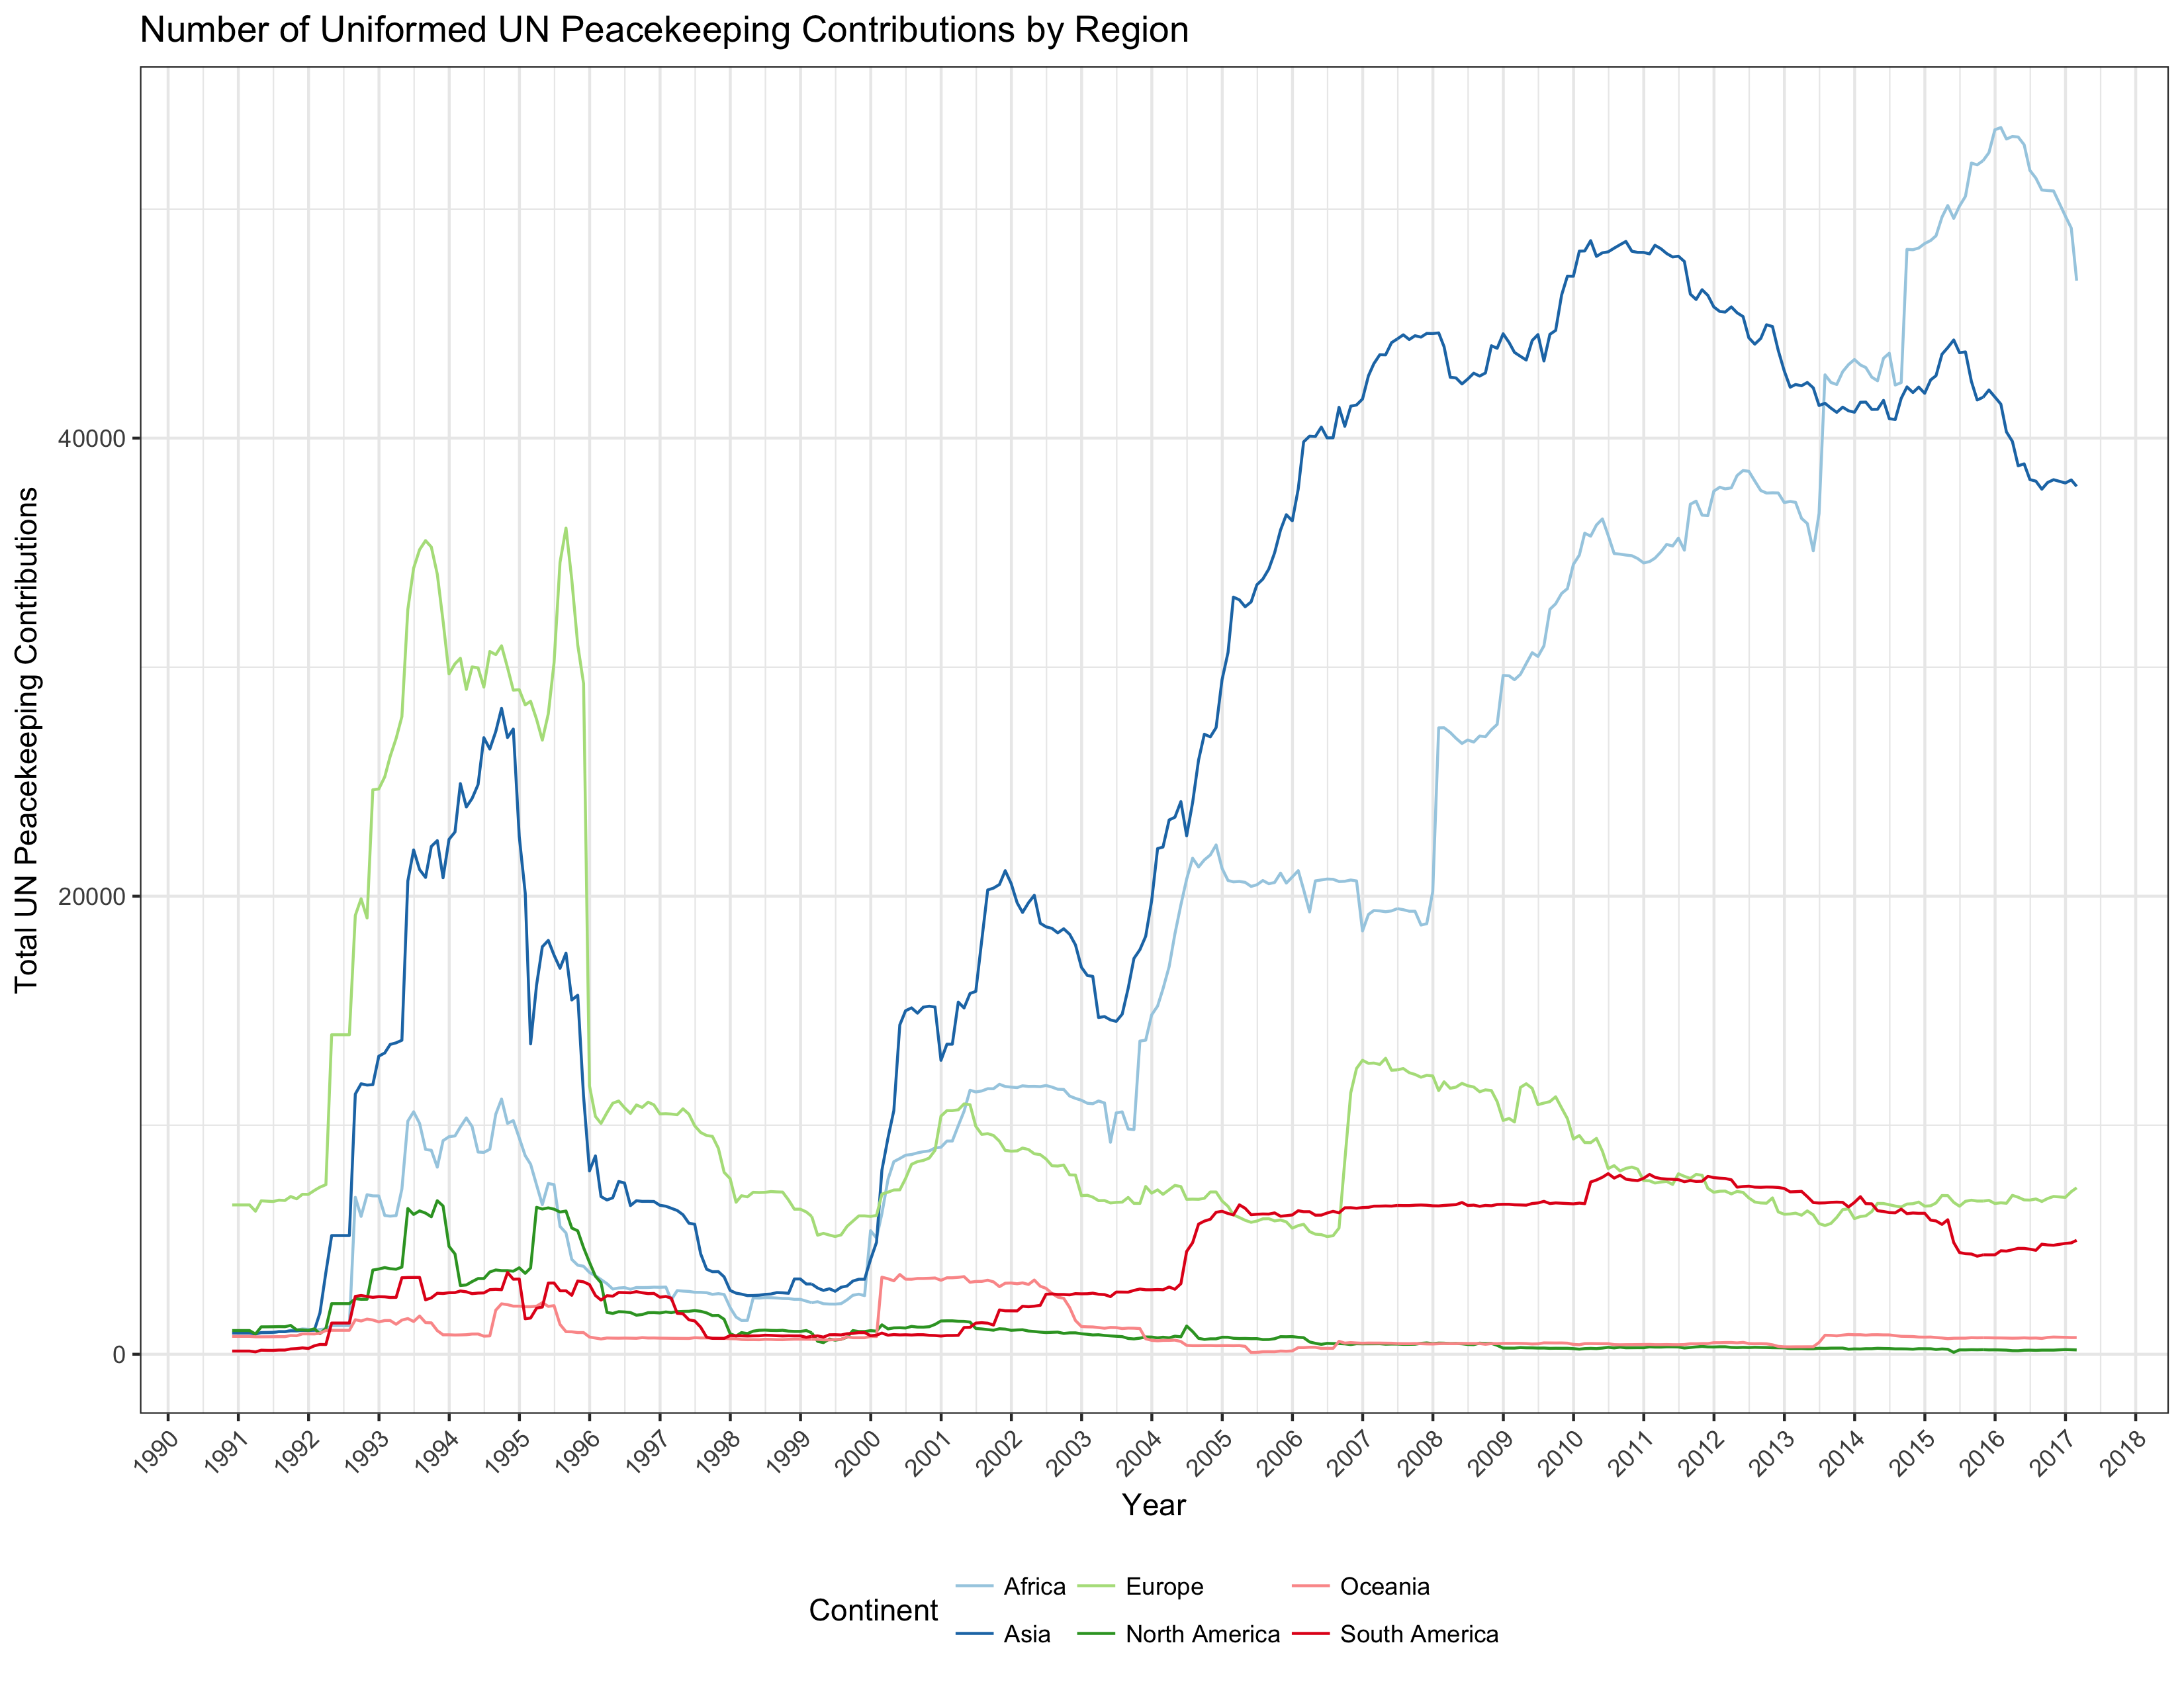
Number of Uniformed UN Peacekeeping Contributions by Region (January 1990 – March 2017)
This graphic shows the number of Uniformed UN Peacekeeping Contributions by Region between January 1990 – March 2017. The central regions are Africa, Asia, Europe, North America, Oceania and South America.
|
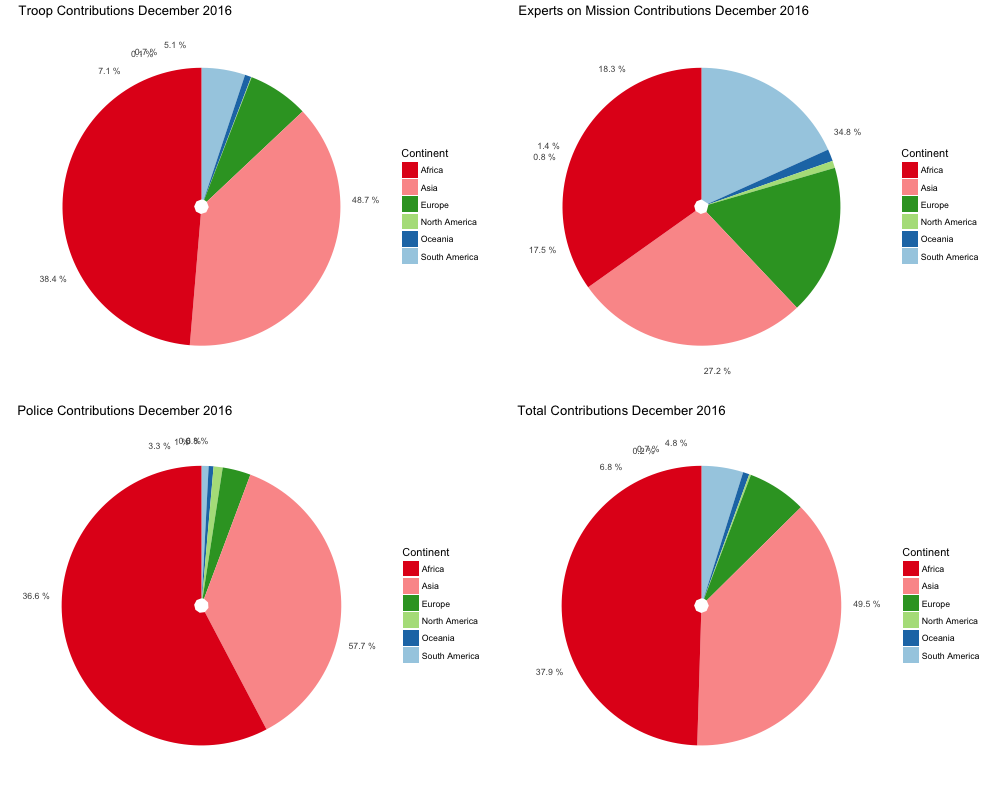
Breakdown of Peacekeepers Contributed by Region as of December 2016
These four pie charts show the breakdown of troops, experts, police and total contribution by region, as of December 2016. The regions are: Africa, Asia, Europe, North America, Oceania, South America.
|
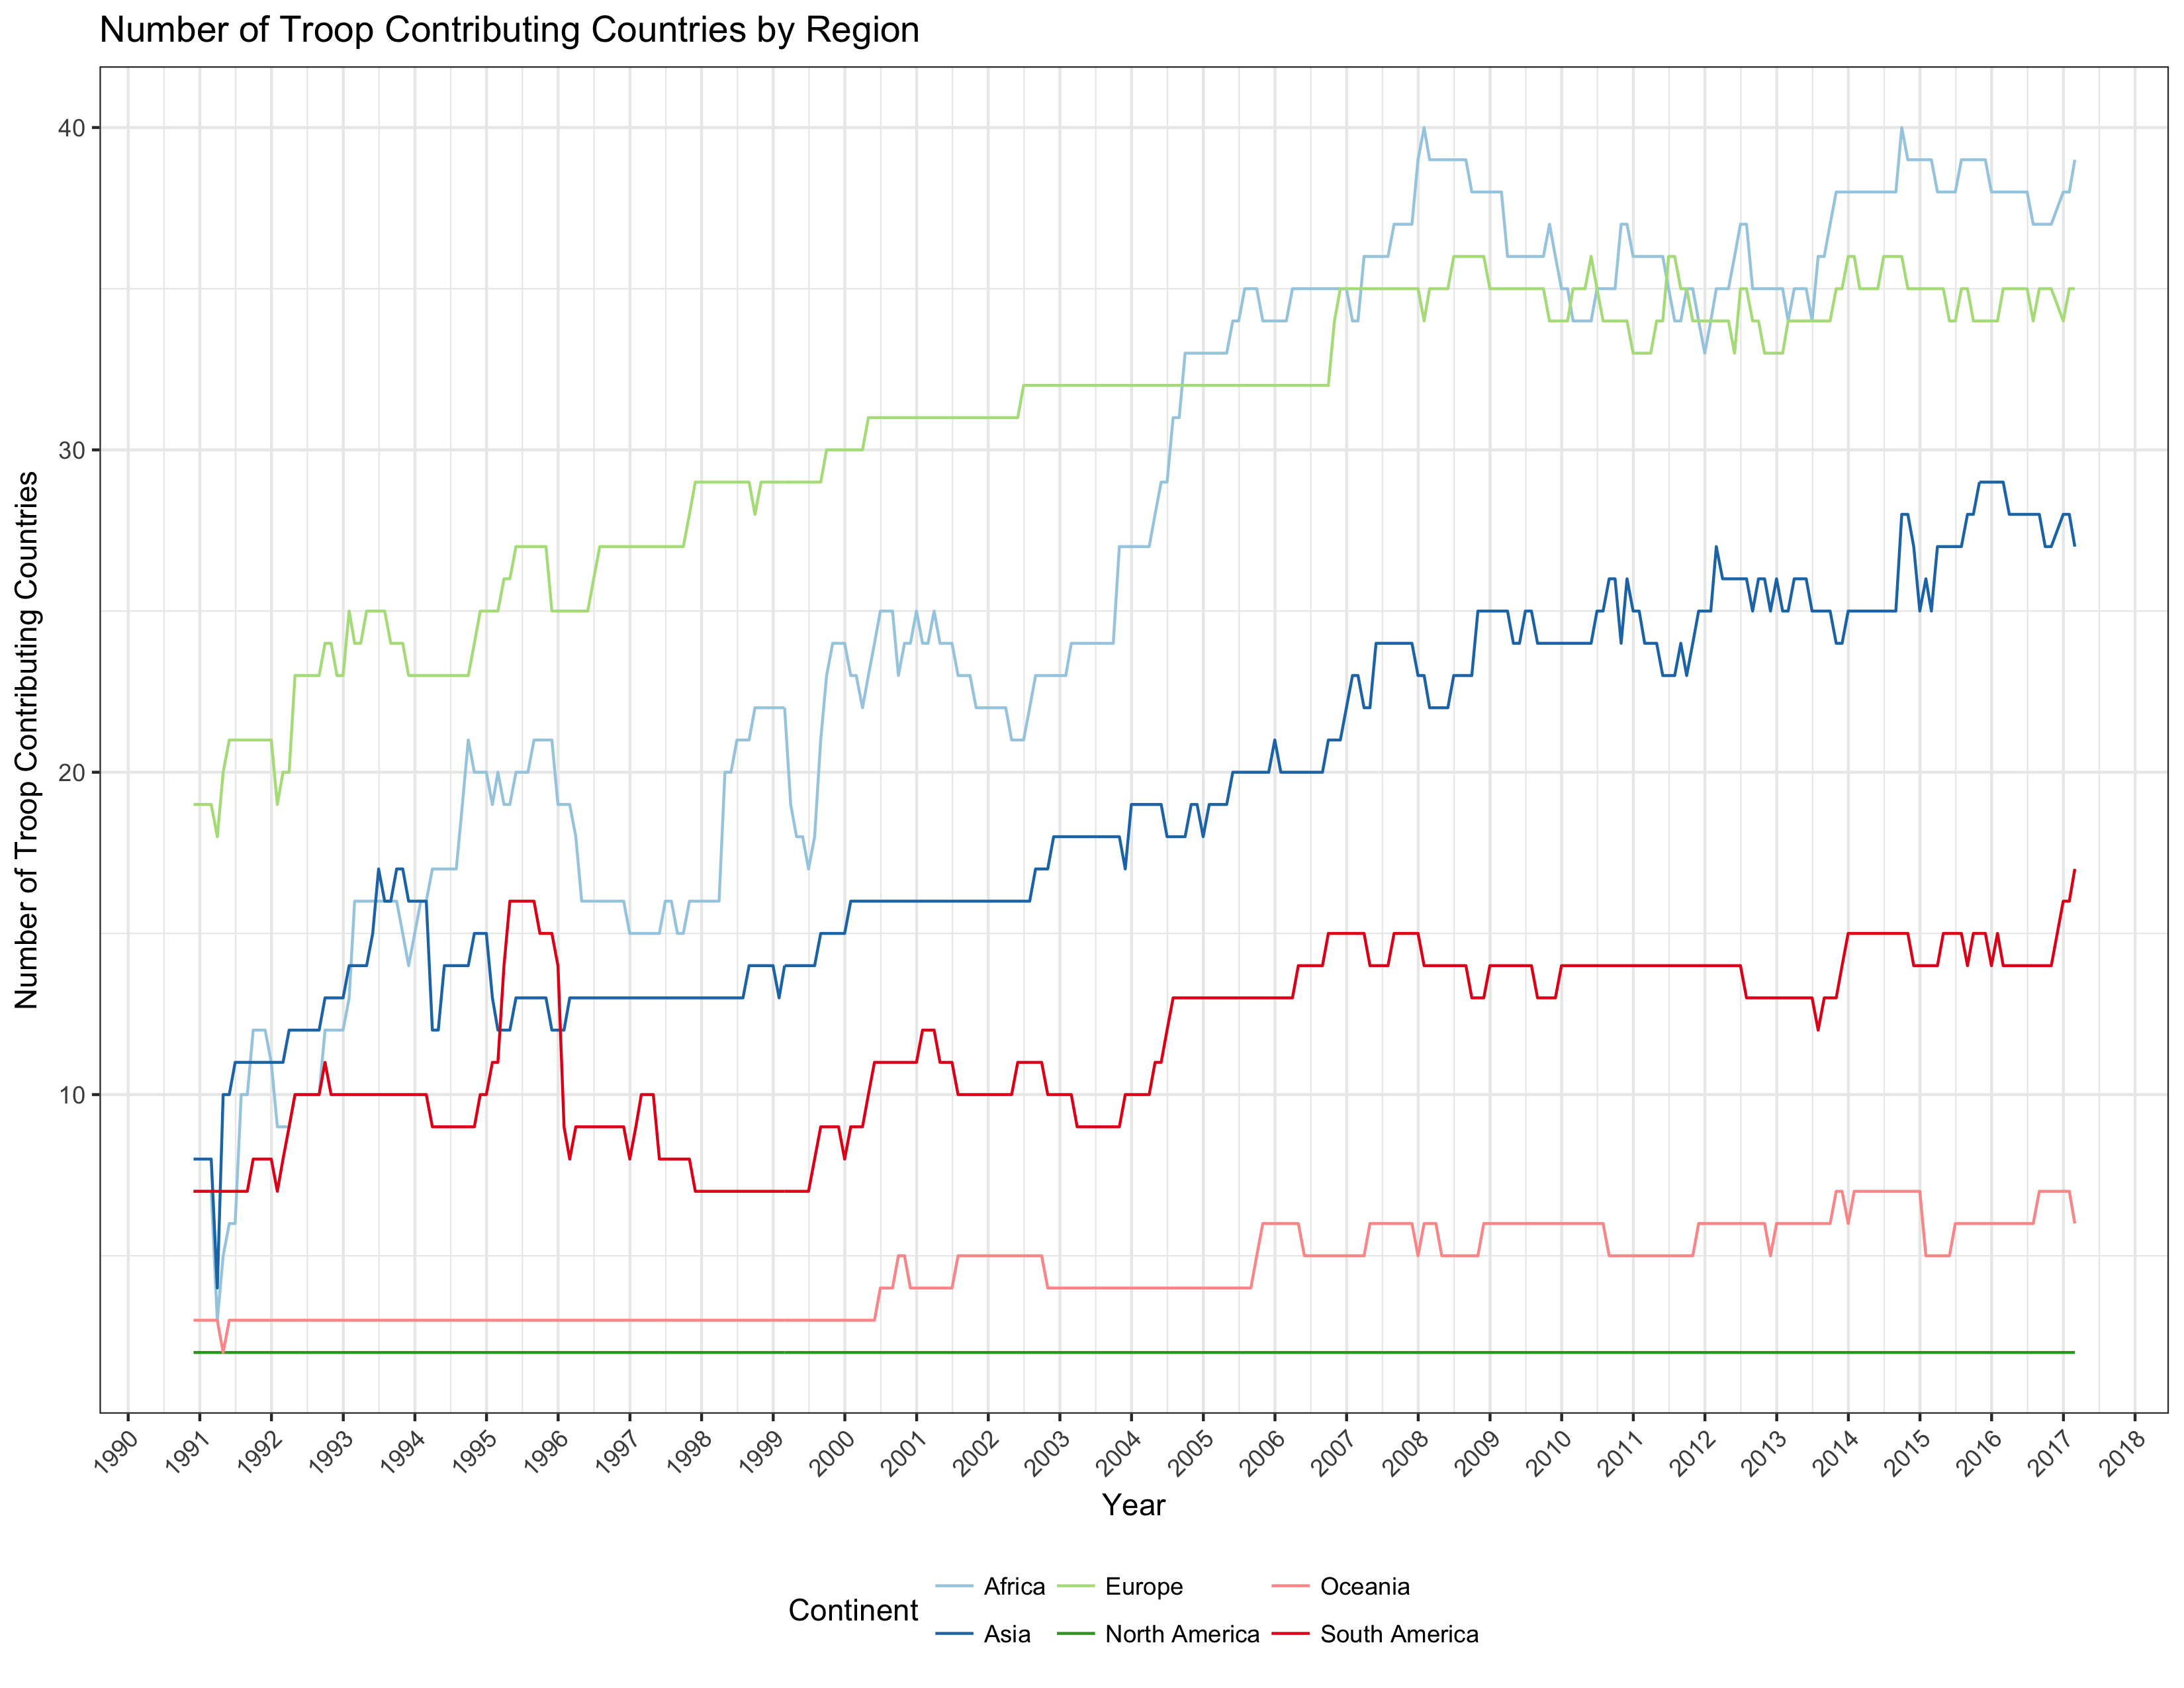
Number of Troops Contributing Countries by Region
This graph shows the number of troops contributing countries by region between 1990 and 2016. The regions are Africa, Asia, Europe, South America, North America and Oceania.
|
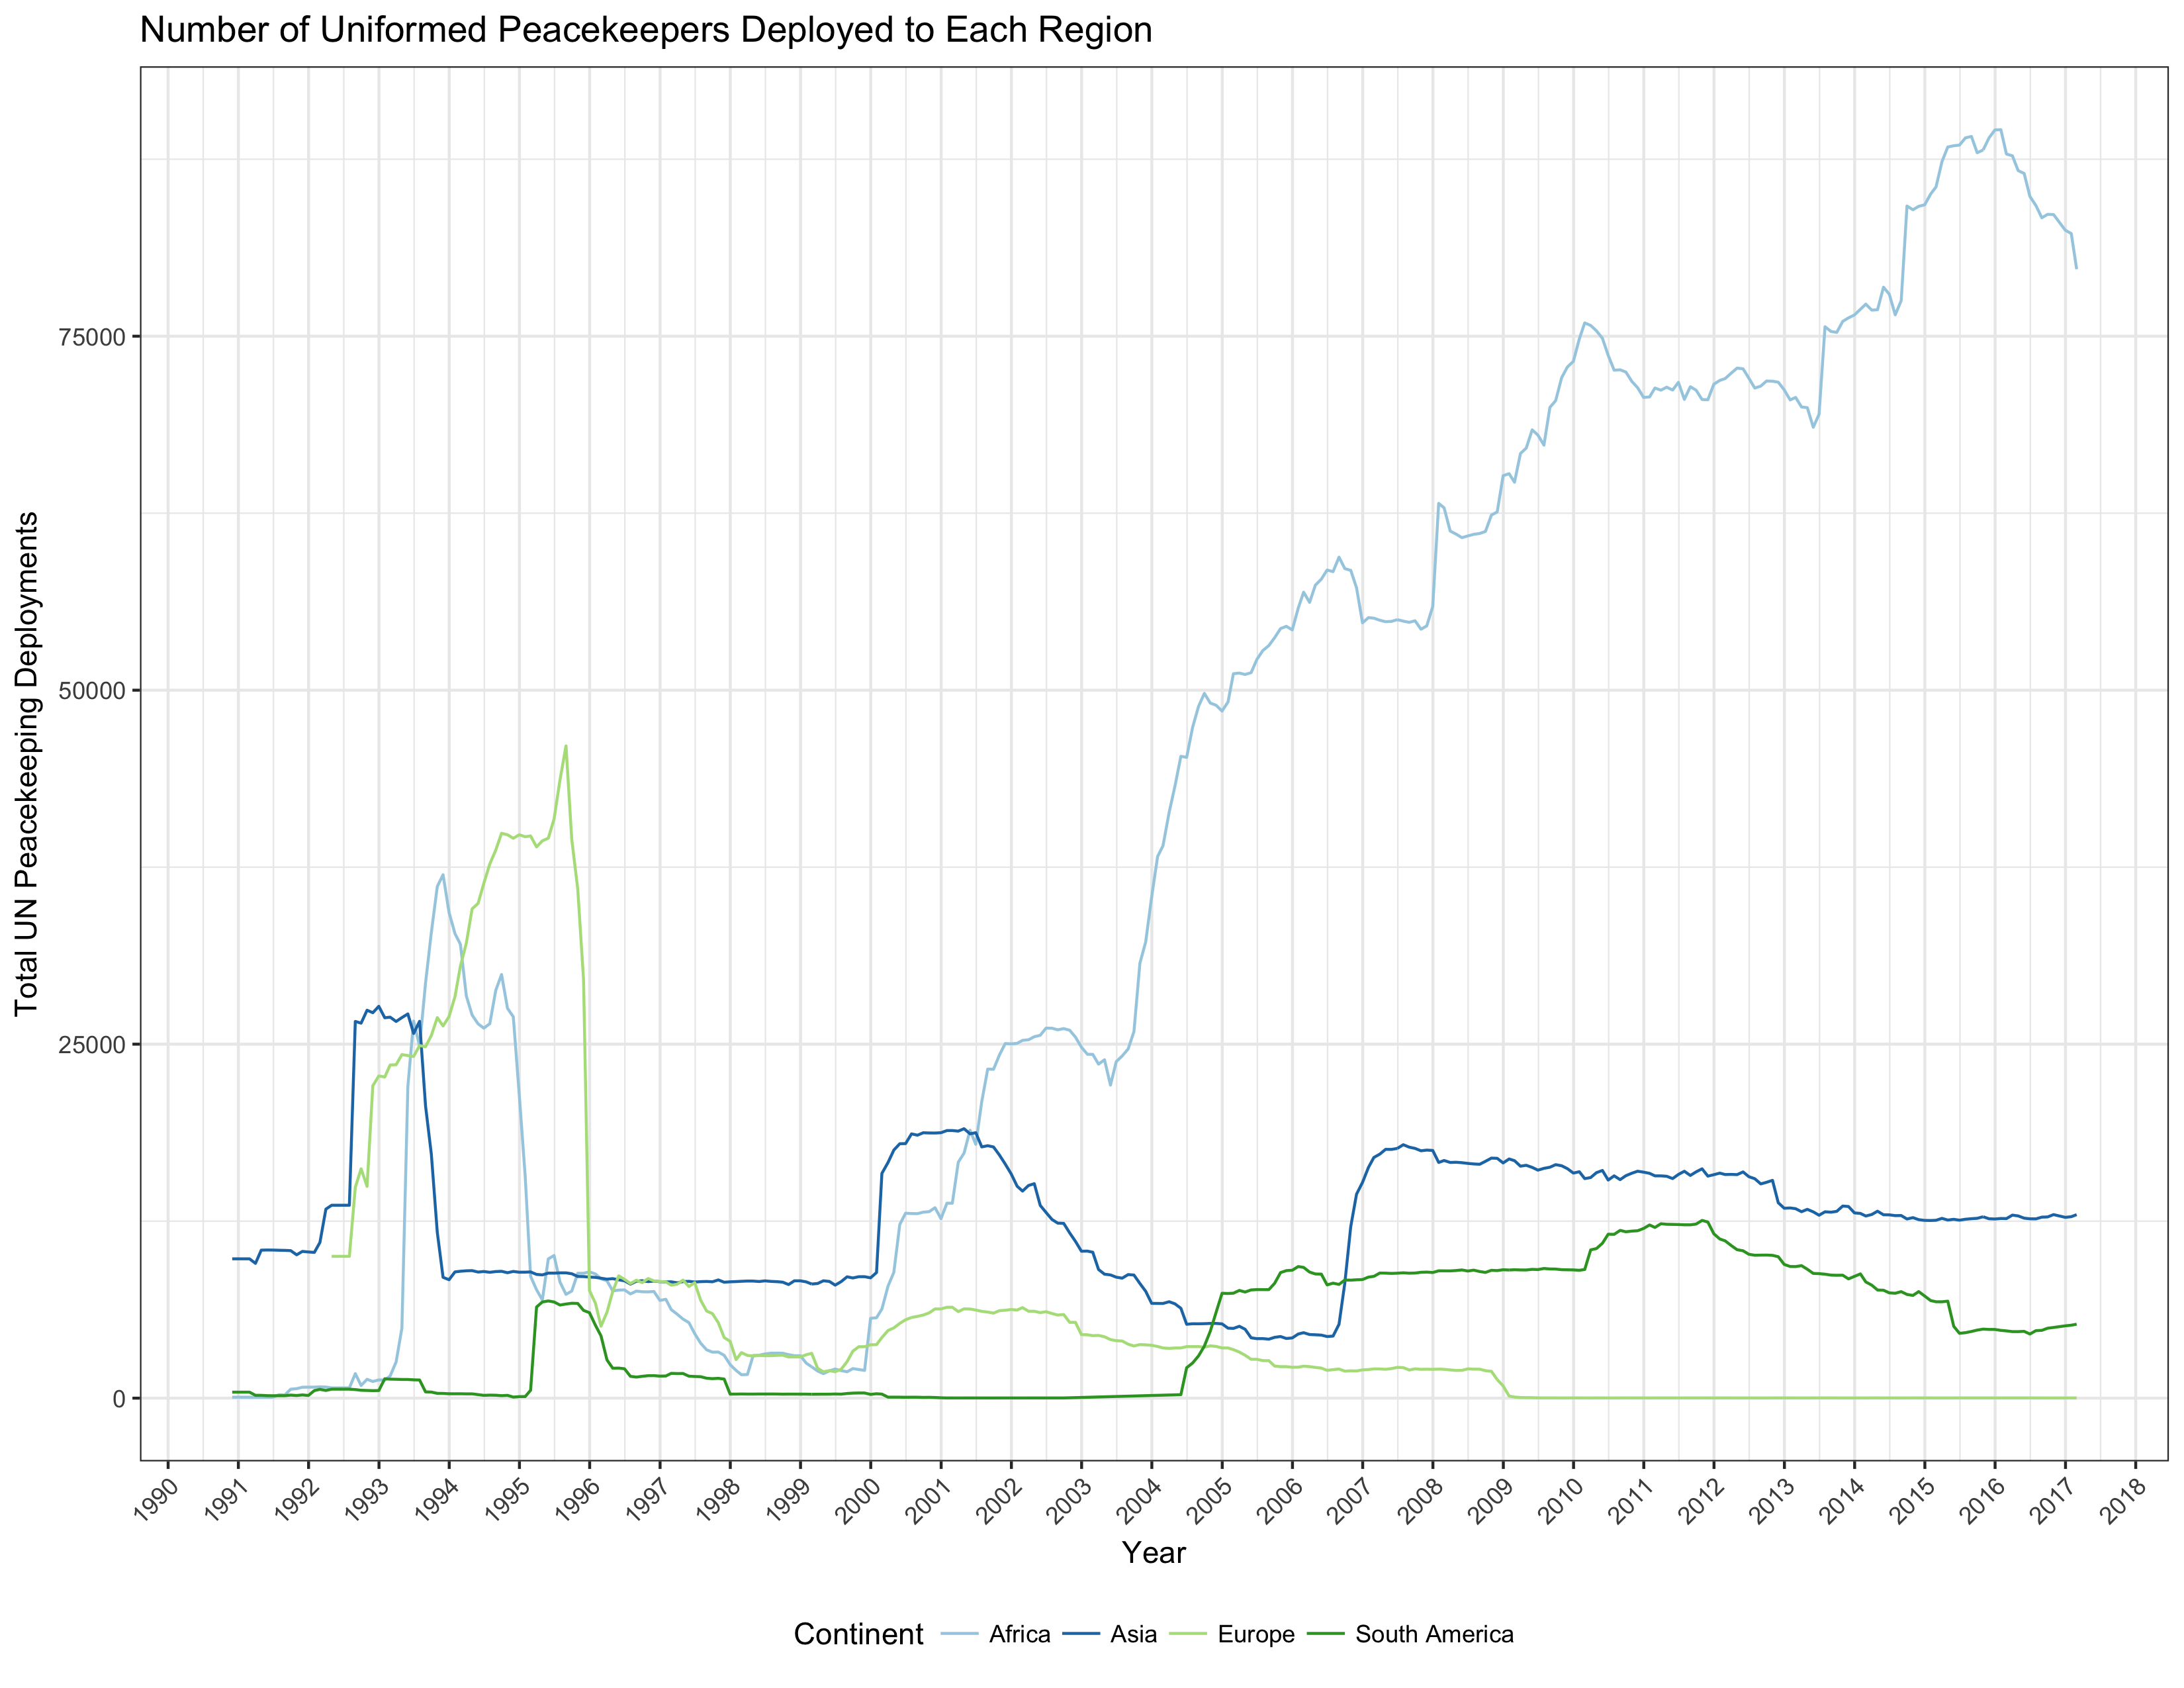
Number of Uniformed Peacekeepers Deployed to Each Region
This graph shows number of uniformed peacekeepers deployed to each region from 1990 to 2016. The regions are Africa, Asia, Europe, South America, North America and Oceania.
|
Women in Peacekeeping
Number of Troops Contributing Countries by Region
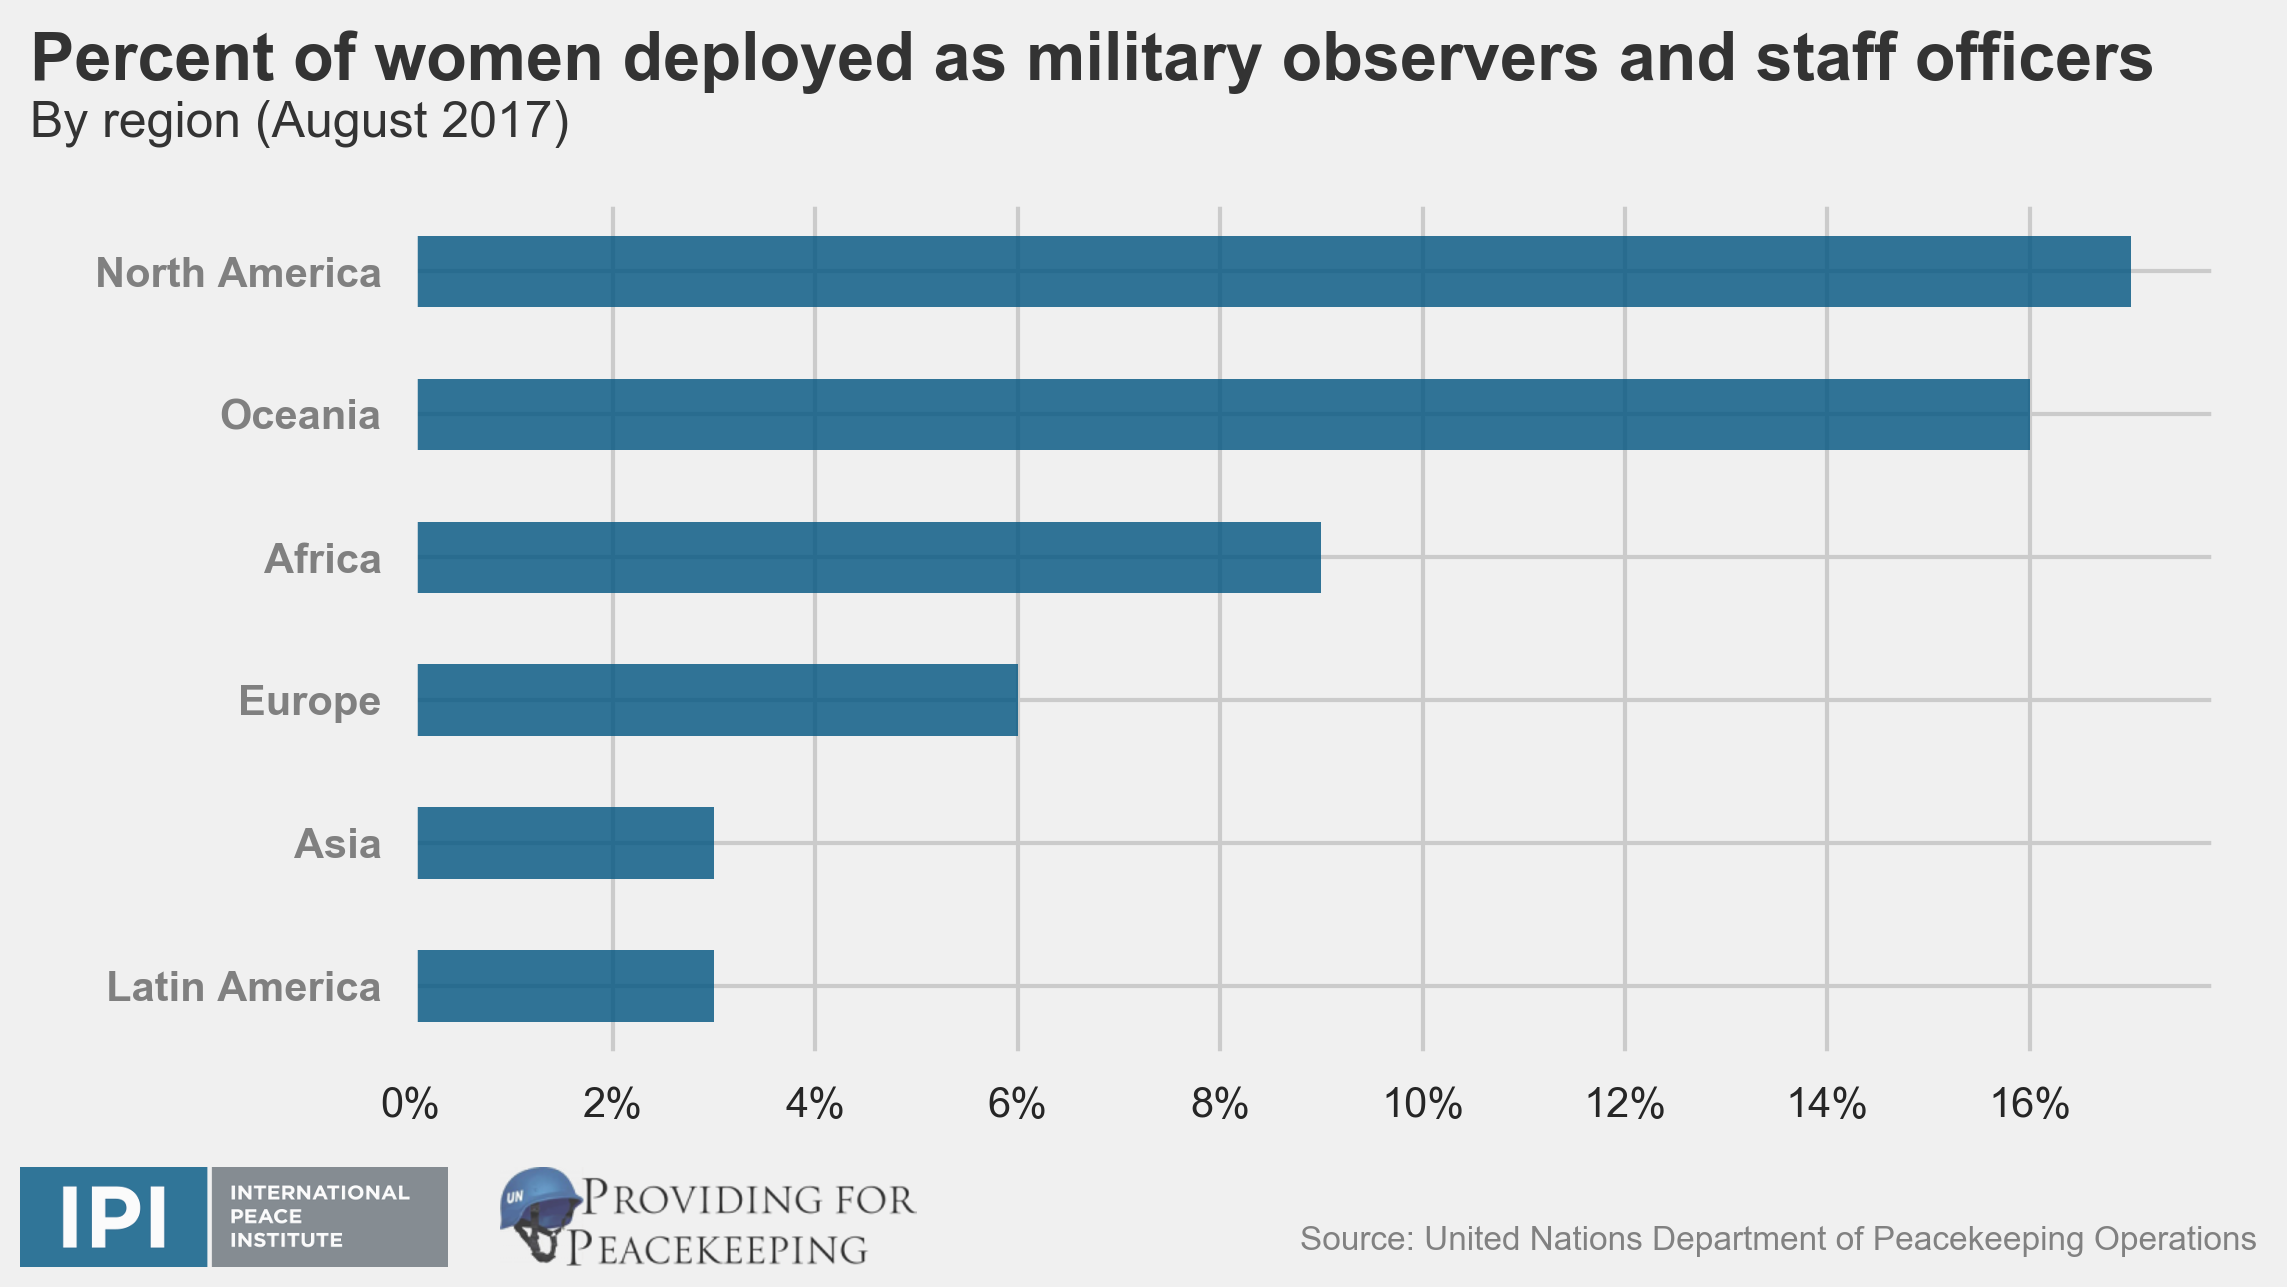
This graph shows the percentage of women who are peacekeeping military observers or staff by region from August 2017. By the end of 2017, the UN has set a target of recruiting 15% women as military observers and staff officers. As of August 2017, women comprised 6% of all military observers and staff officers. An additional 517 recruits are needed to meet the target goal by the end of the year.
|
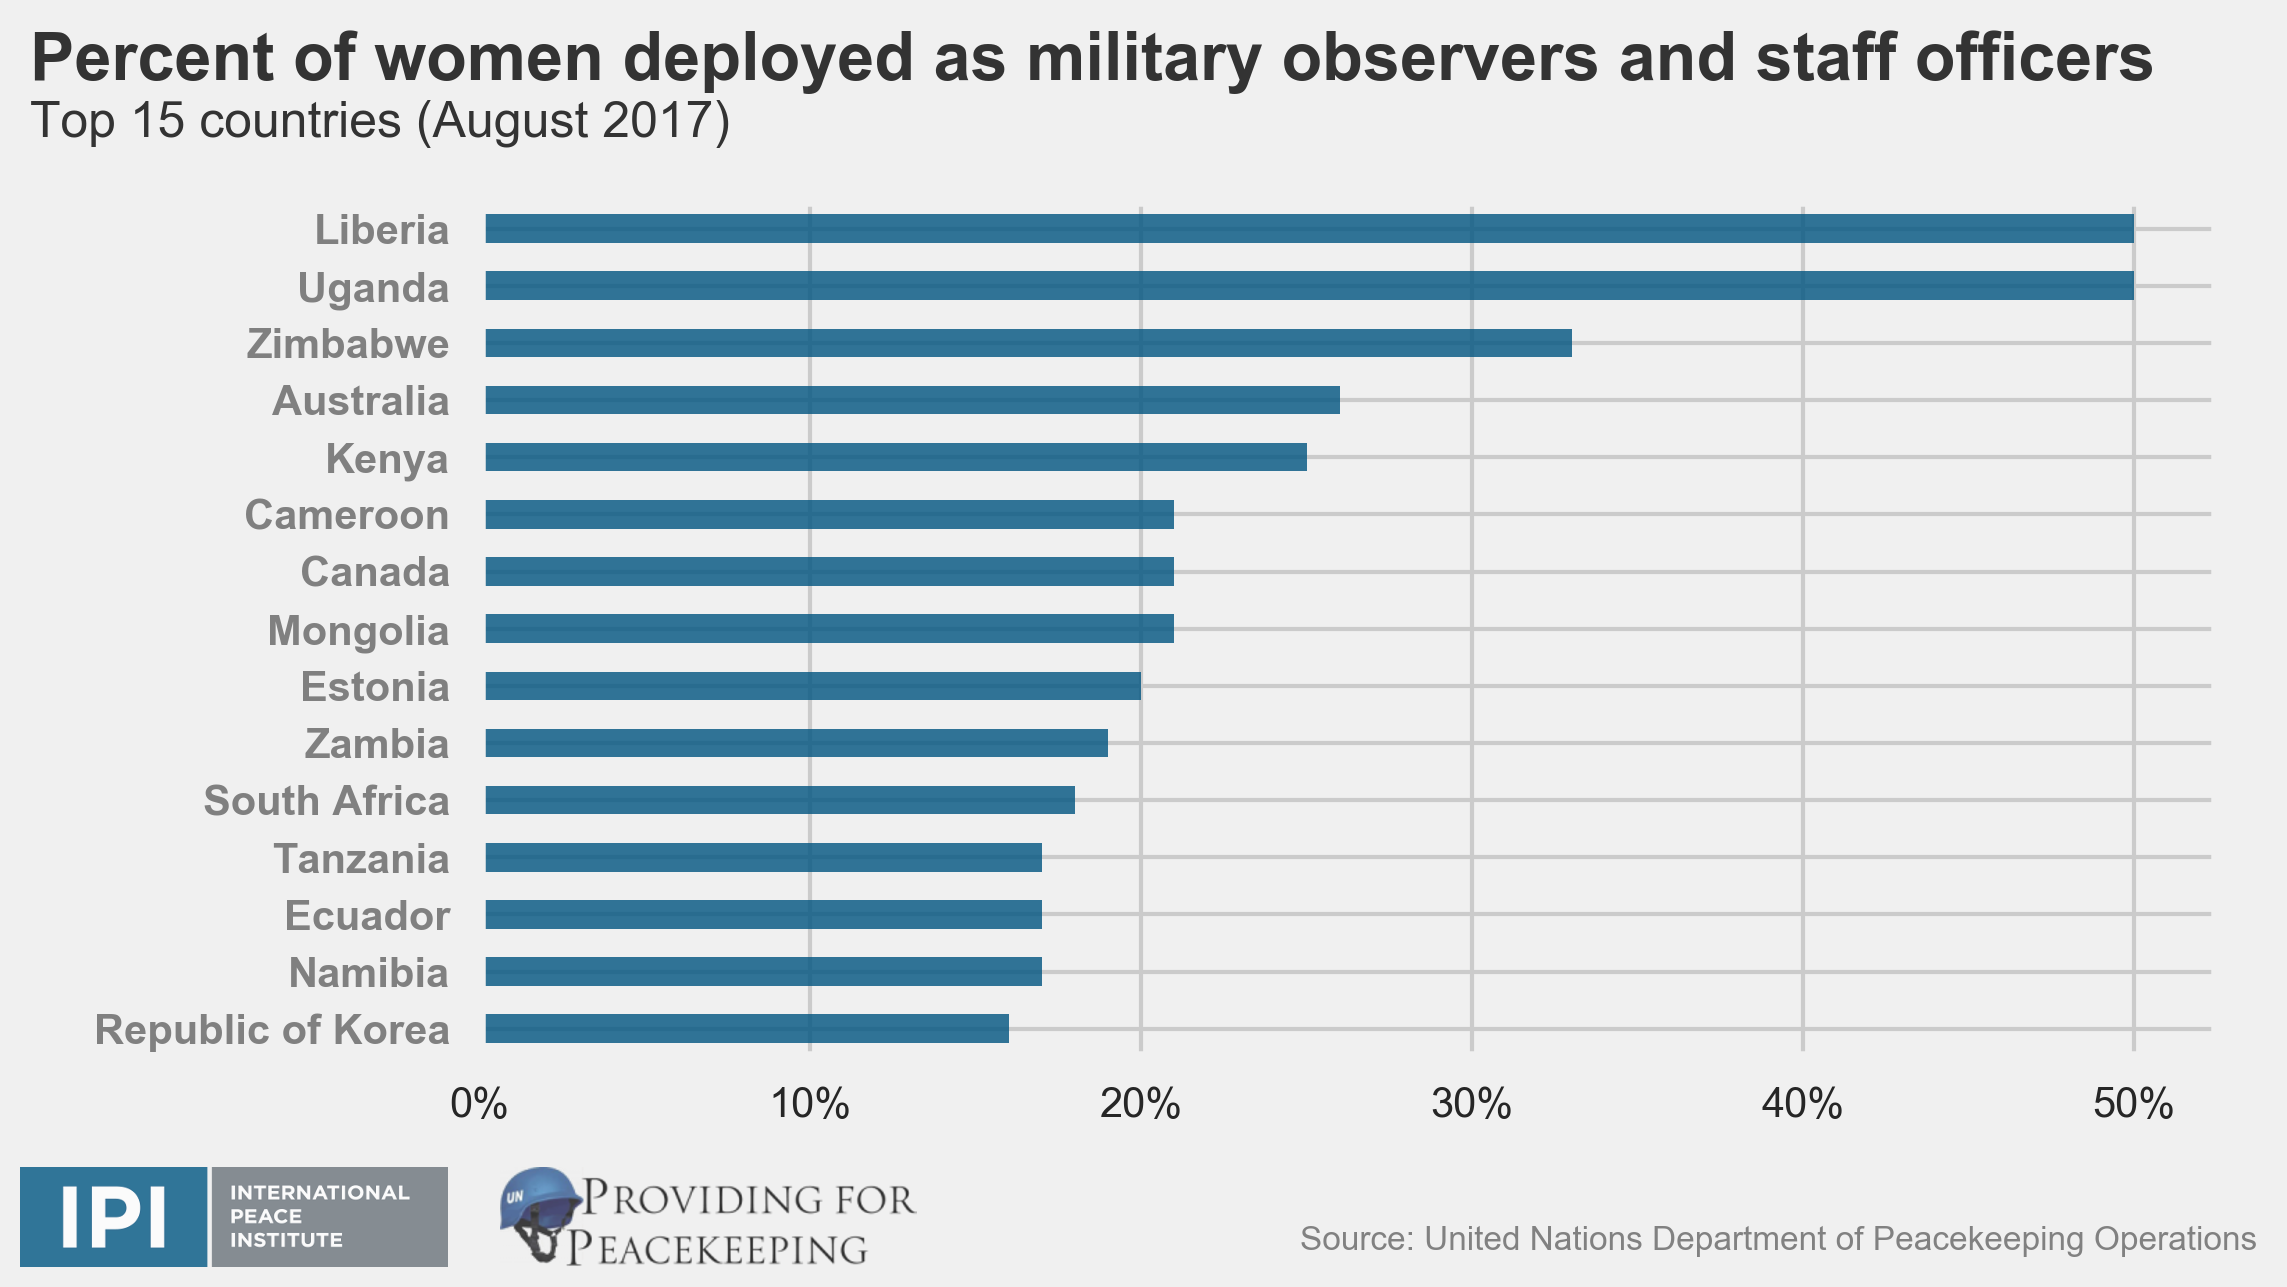
Female Military Observers and Staff from Top Contributing Countries
This graph shows the top 15 countries with the highest percentage of women who are peacekeeping military observers or staff from August 2017. 16 countries are meeting the target goal of 15% female military observers and staff (not pictured in this graph for space reasons, USA).
|
Neighboring Country Contributions to Missions
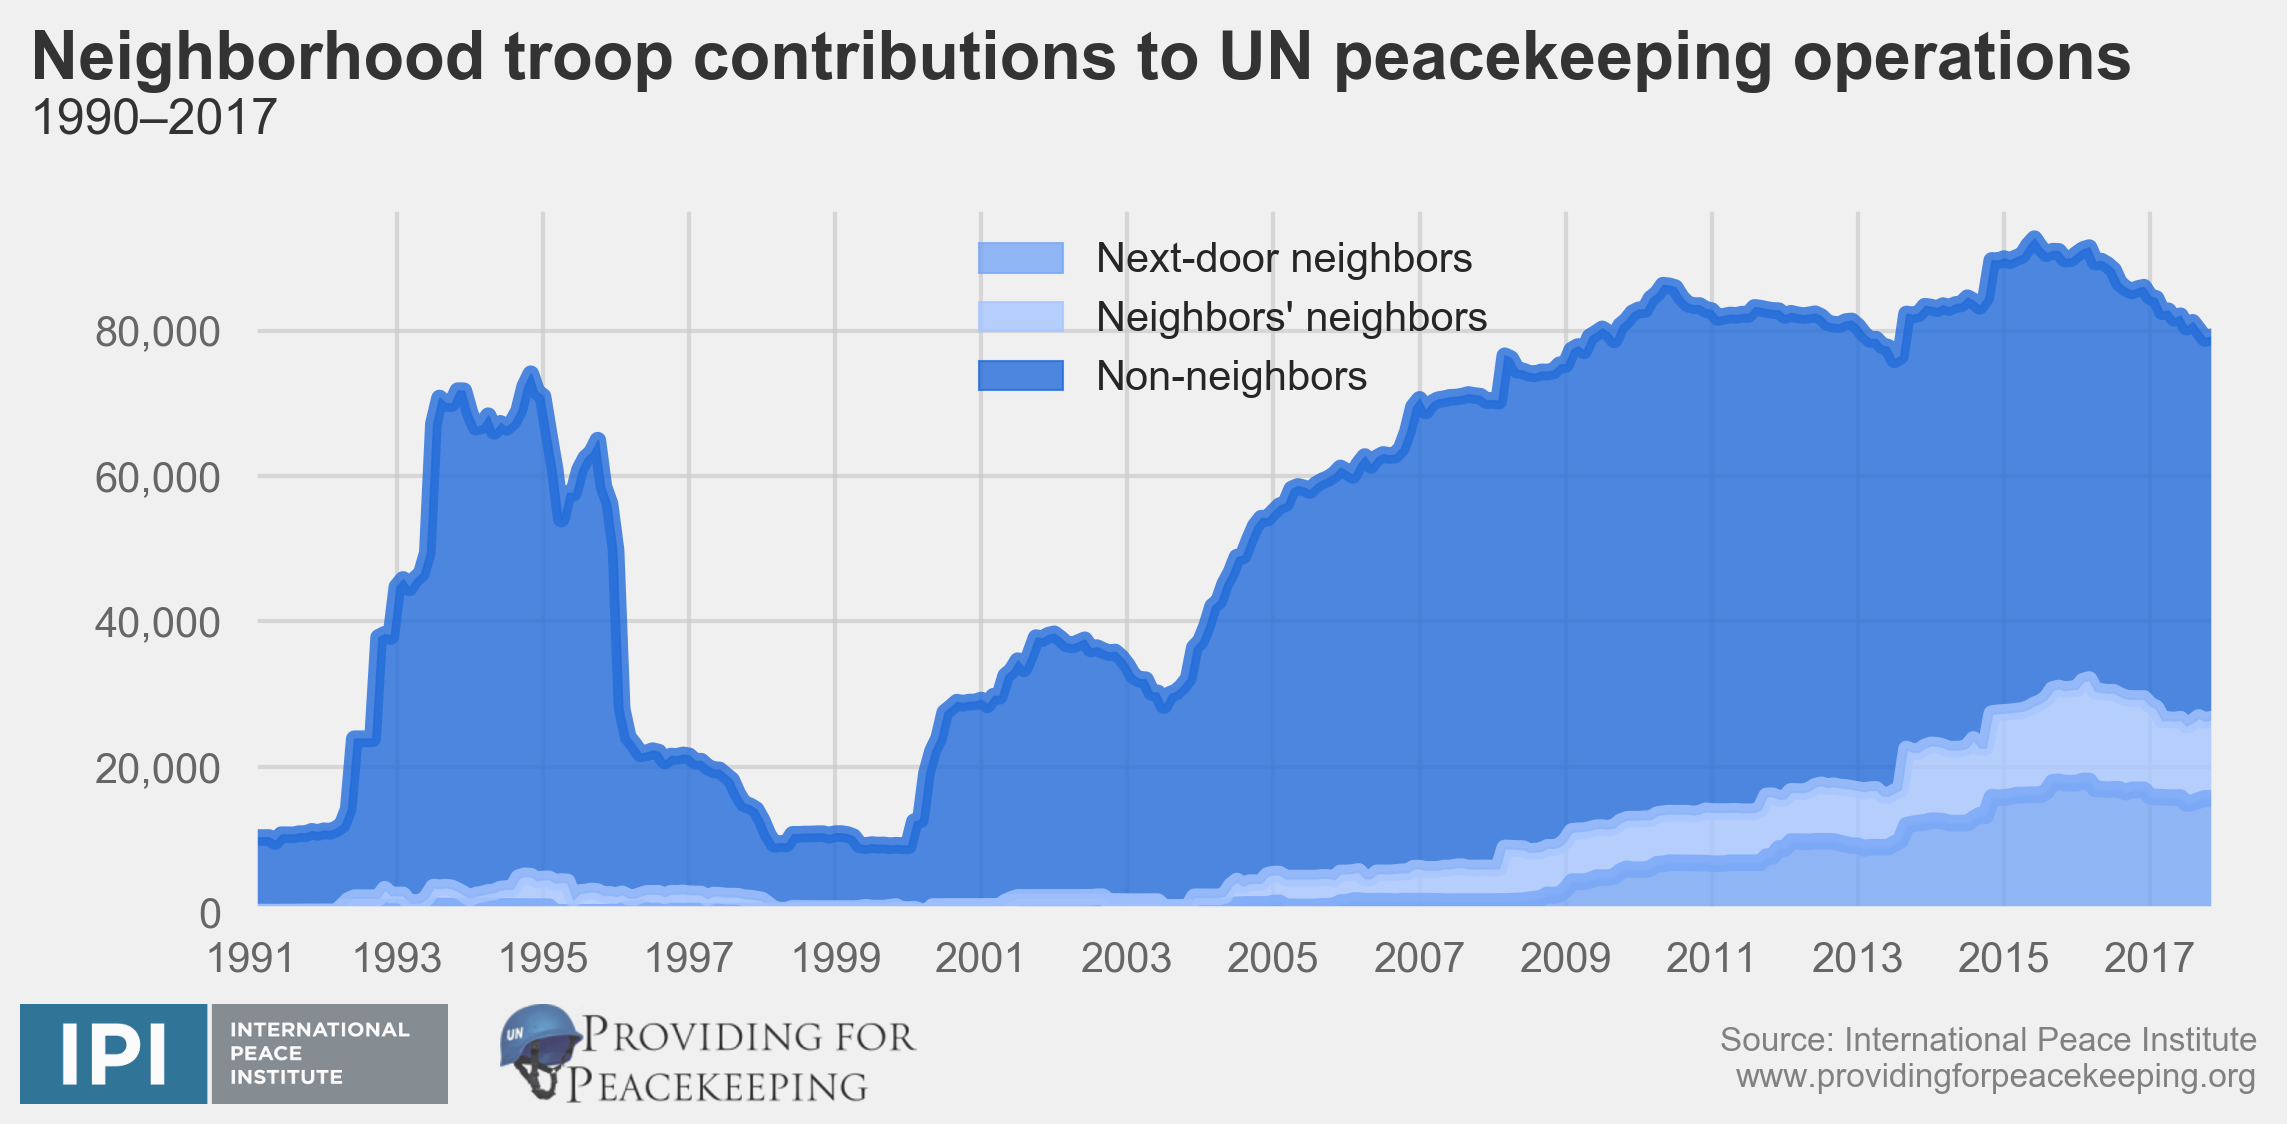
Neighborhood troop contributions to UN peacekeeping operations
This graph shows neighborhood troop contributions from 1990–2017.
|
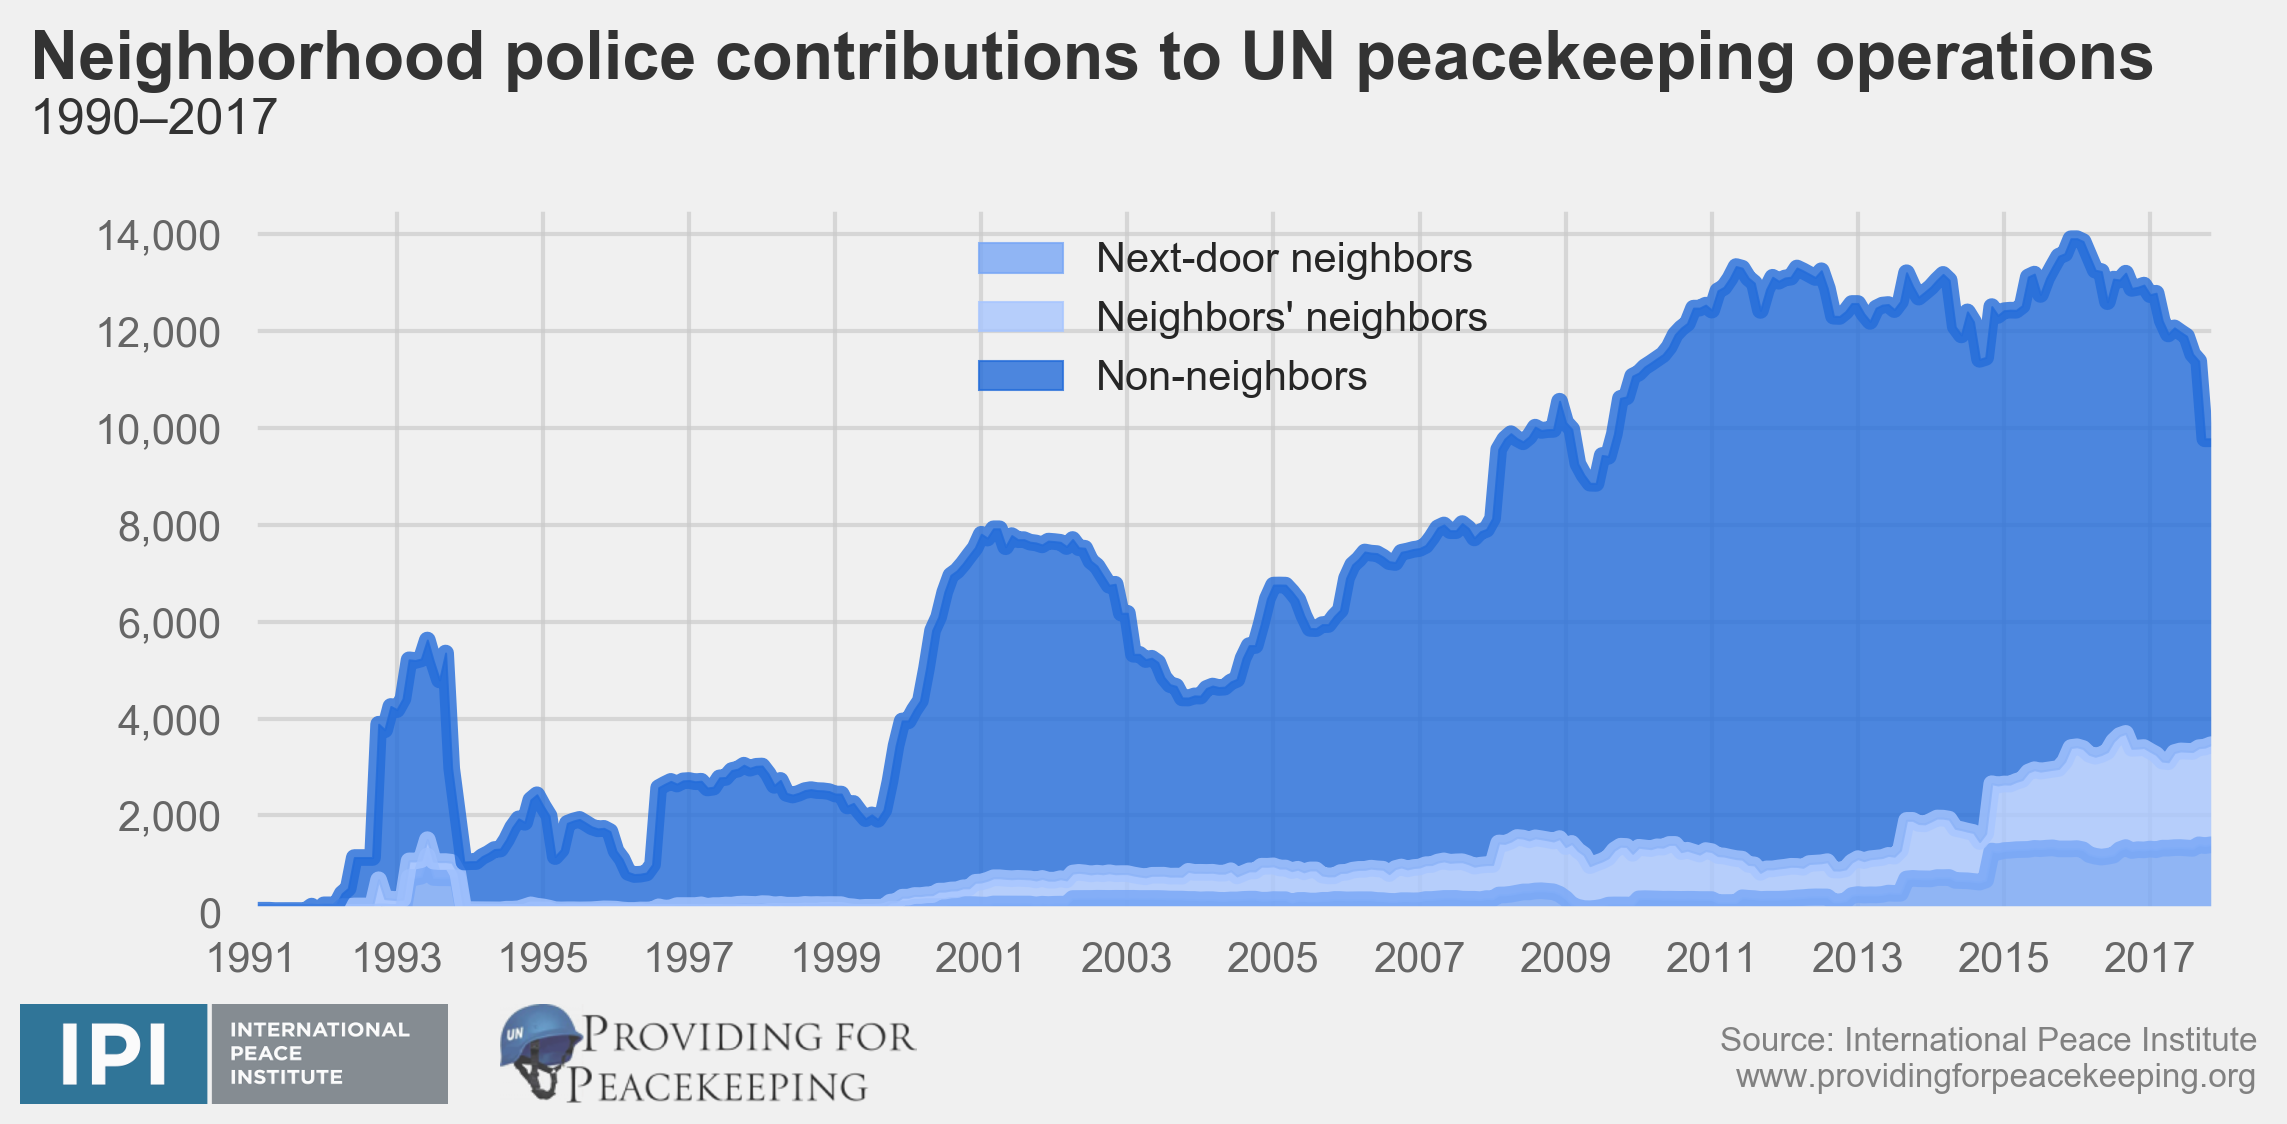
Neighborhood police contributions to UN peacekeeping operations
This graph shows neighborhood police contributions from 1990–2017.
|
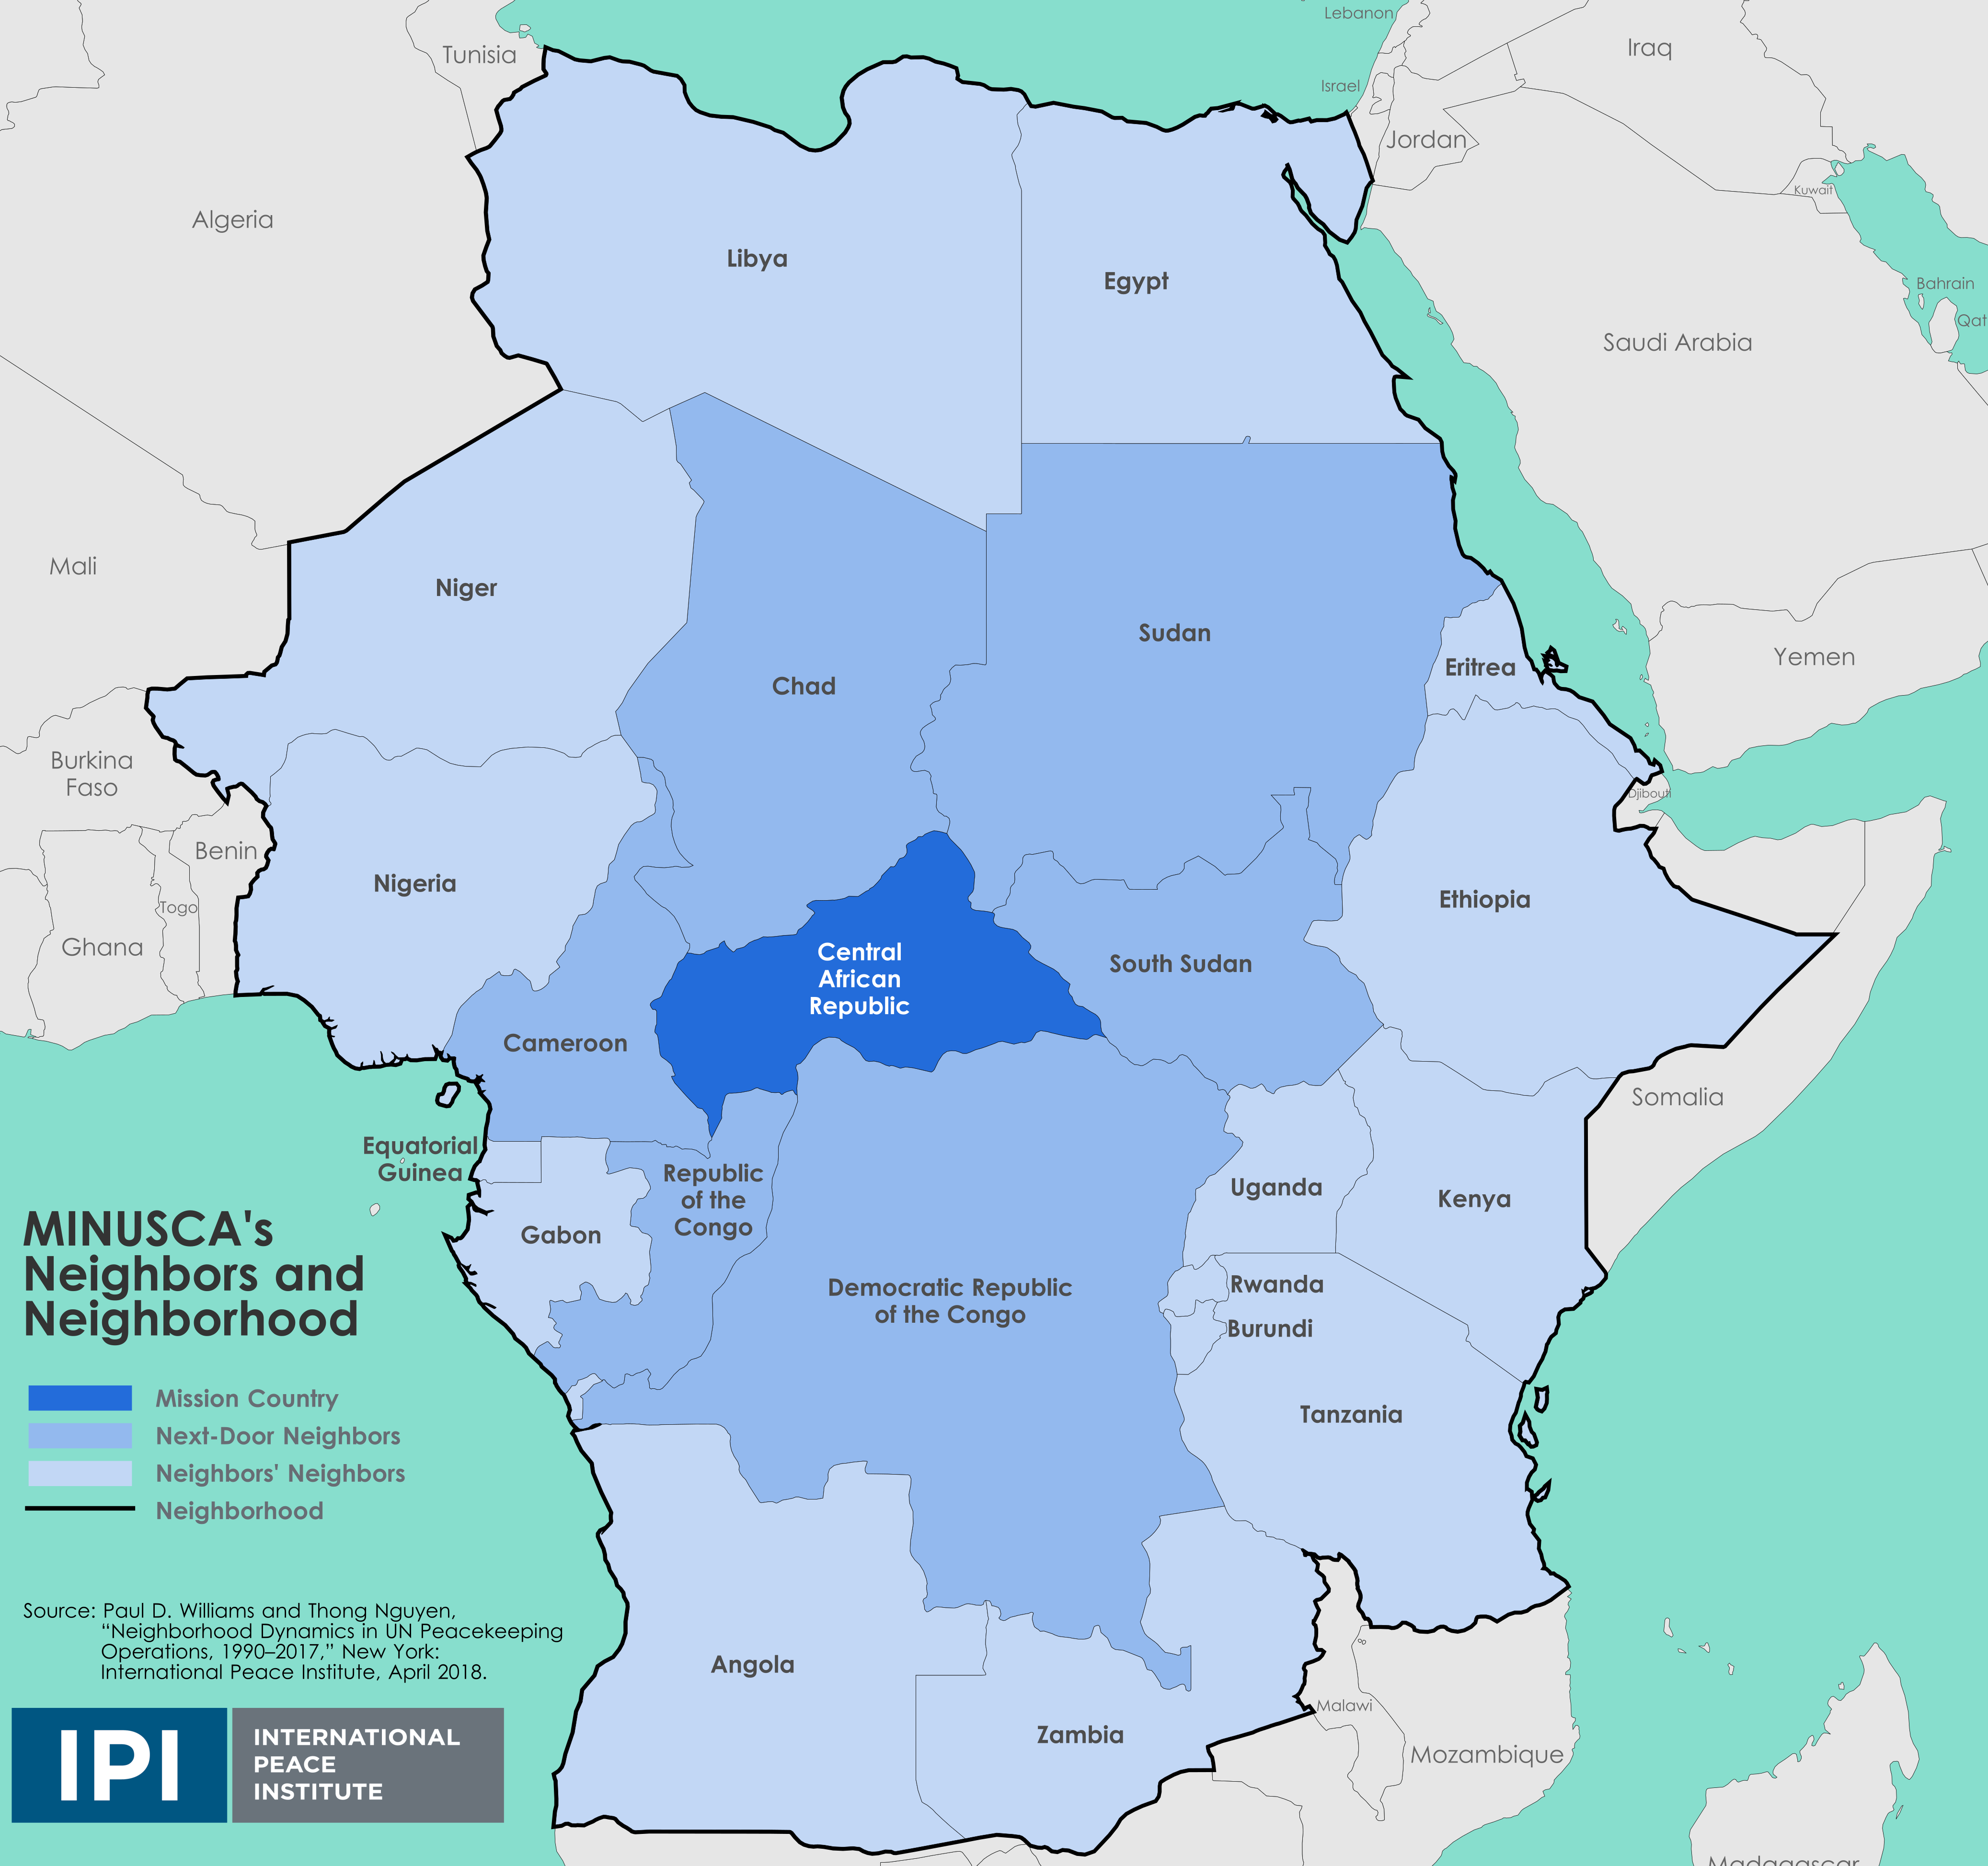
Conceptualizing the neighborhood: MINUSCA
This map shows illustrates our definition of neighbors using MINUSCA as an example. Next-door neighbors are countries sharing a border with the mission country; neighbors’ neighbors are those countries that border next-door neighbors; and the neighborhood combines next-door and neighbors’ neighbors countries.
|
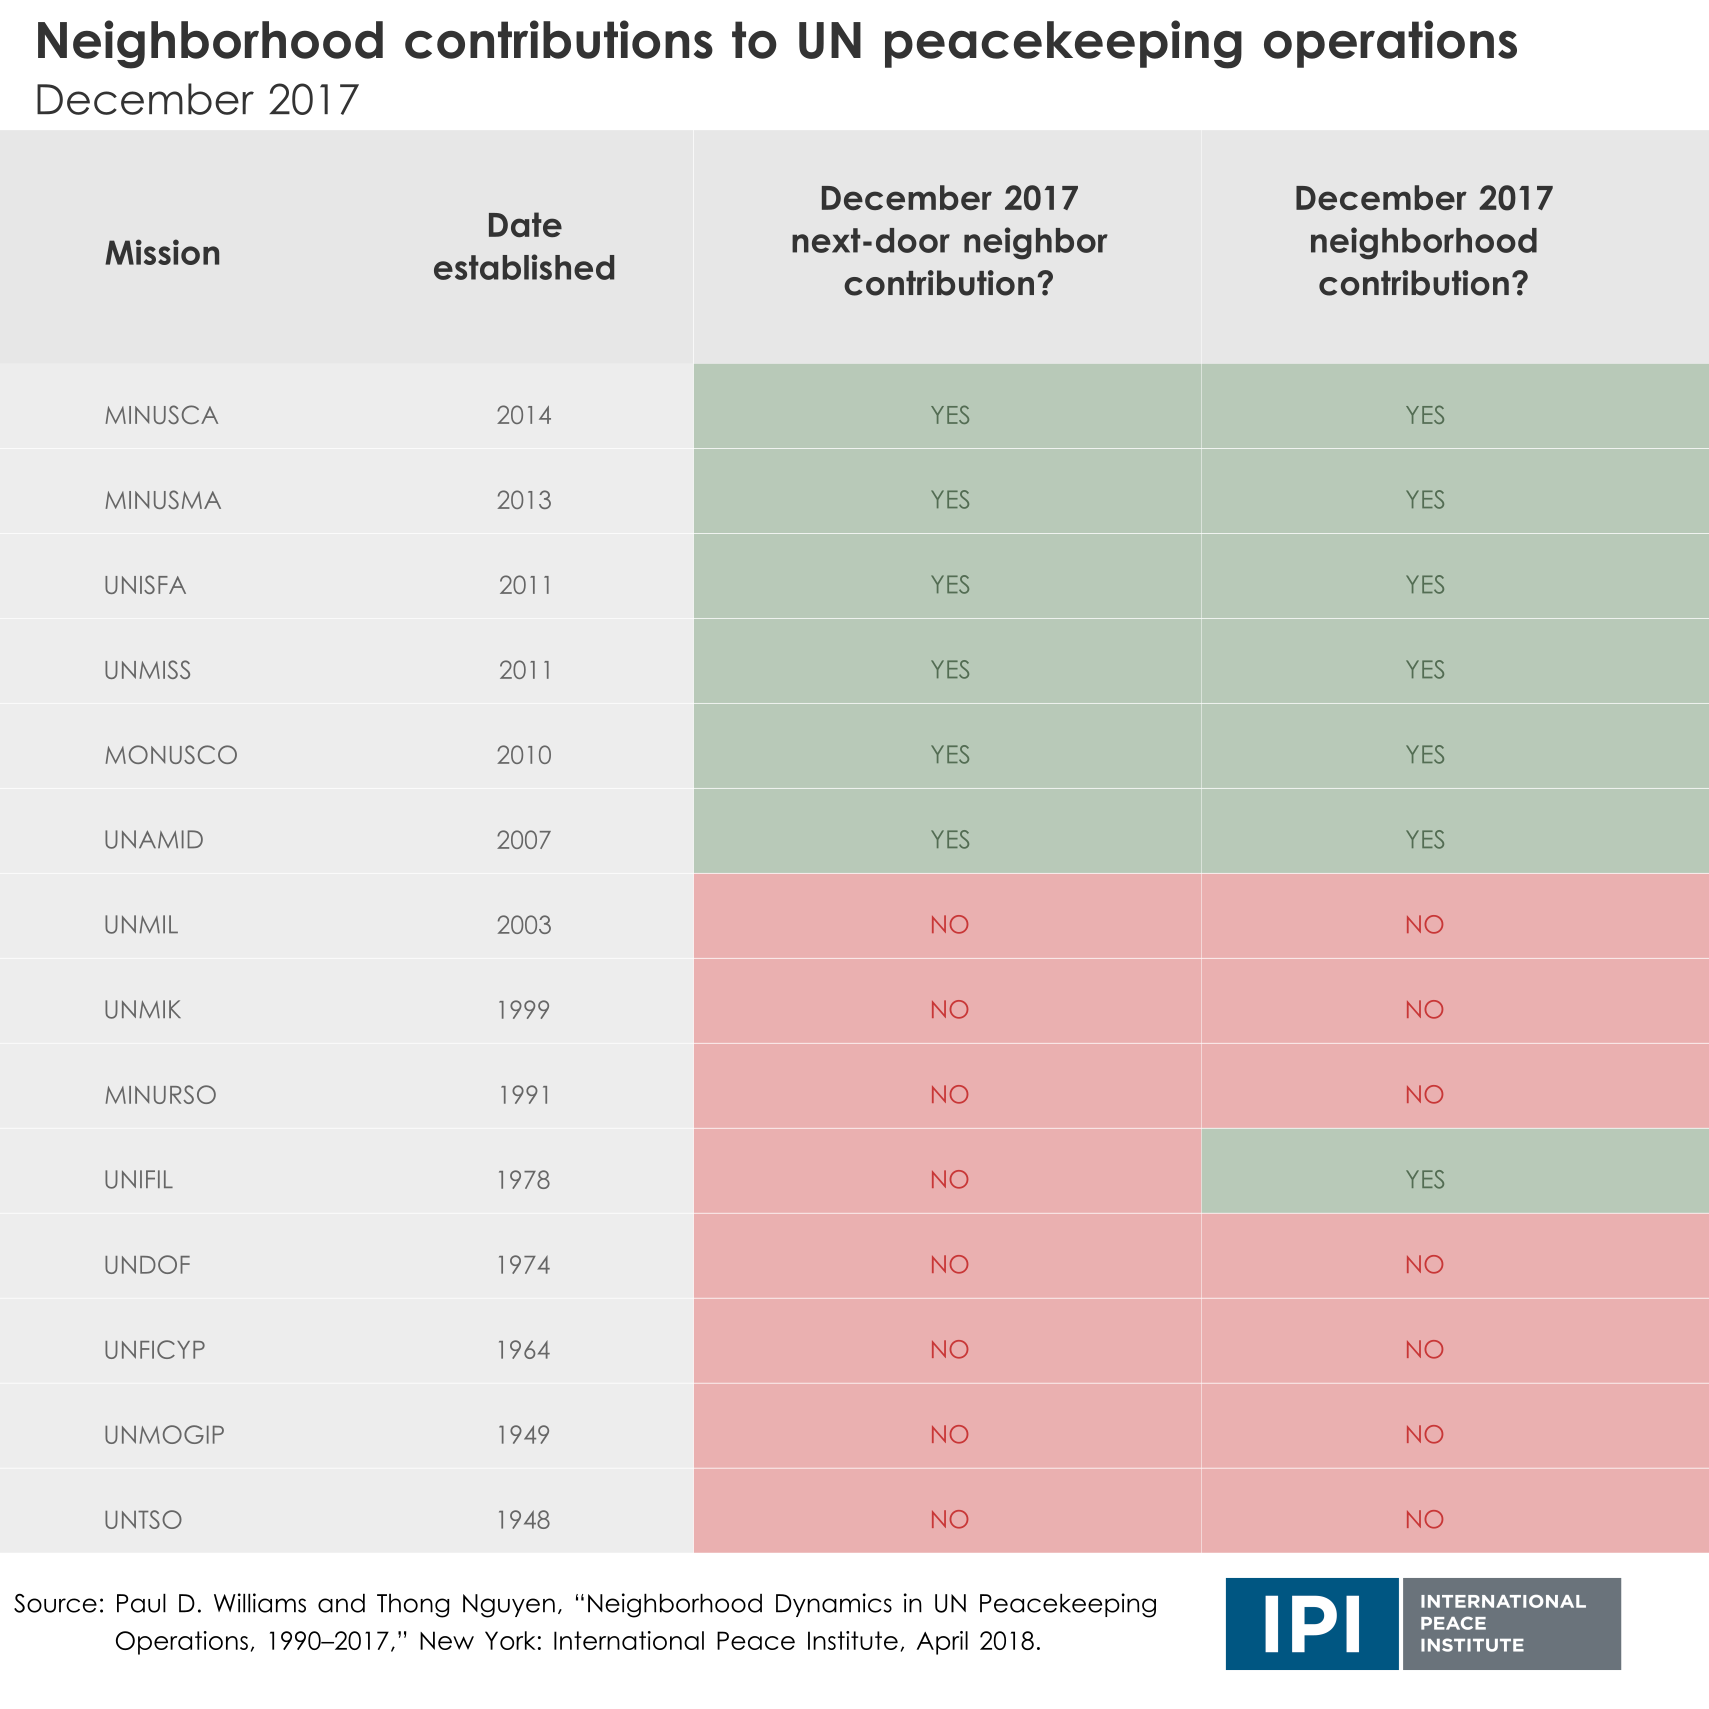
Neighborhood contributions to UN peacekeeping operations
This table shows that all current missions (December 2017) established after 2007 received neighboring contributions, whereas most missions established before did not.
|
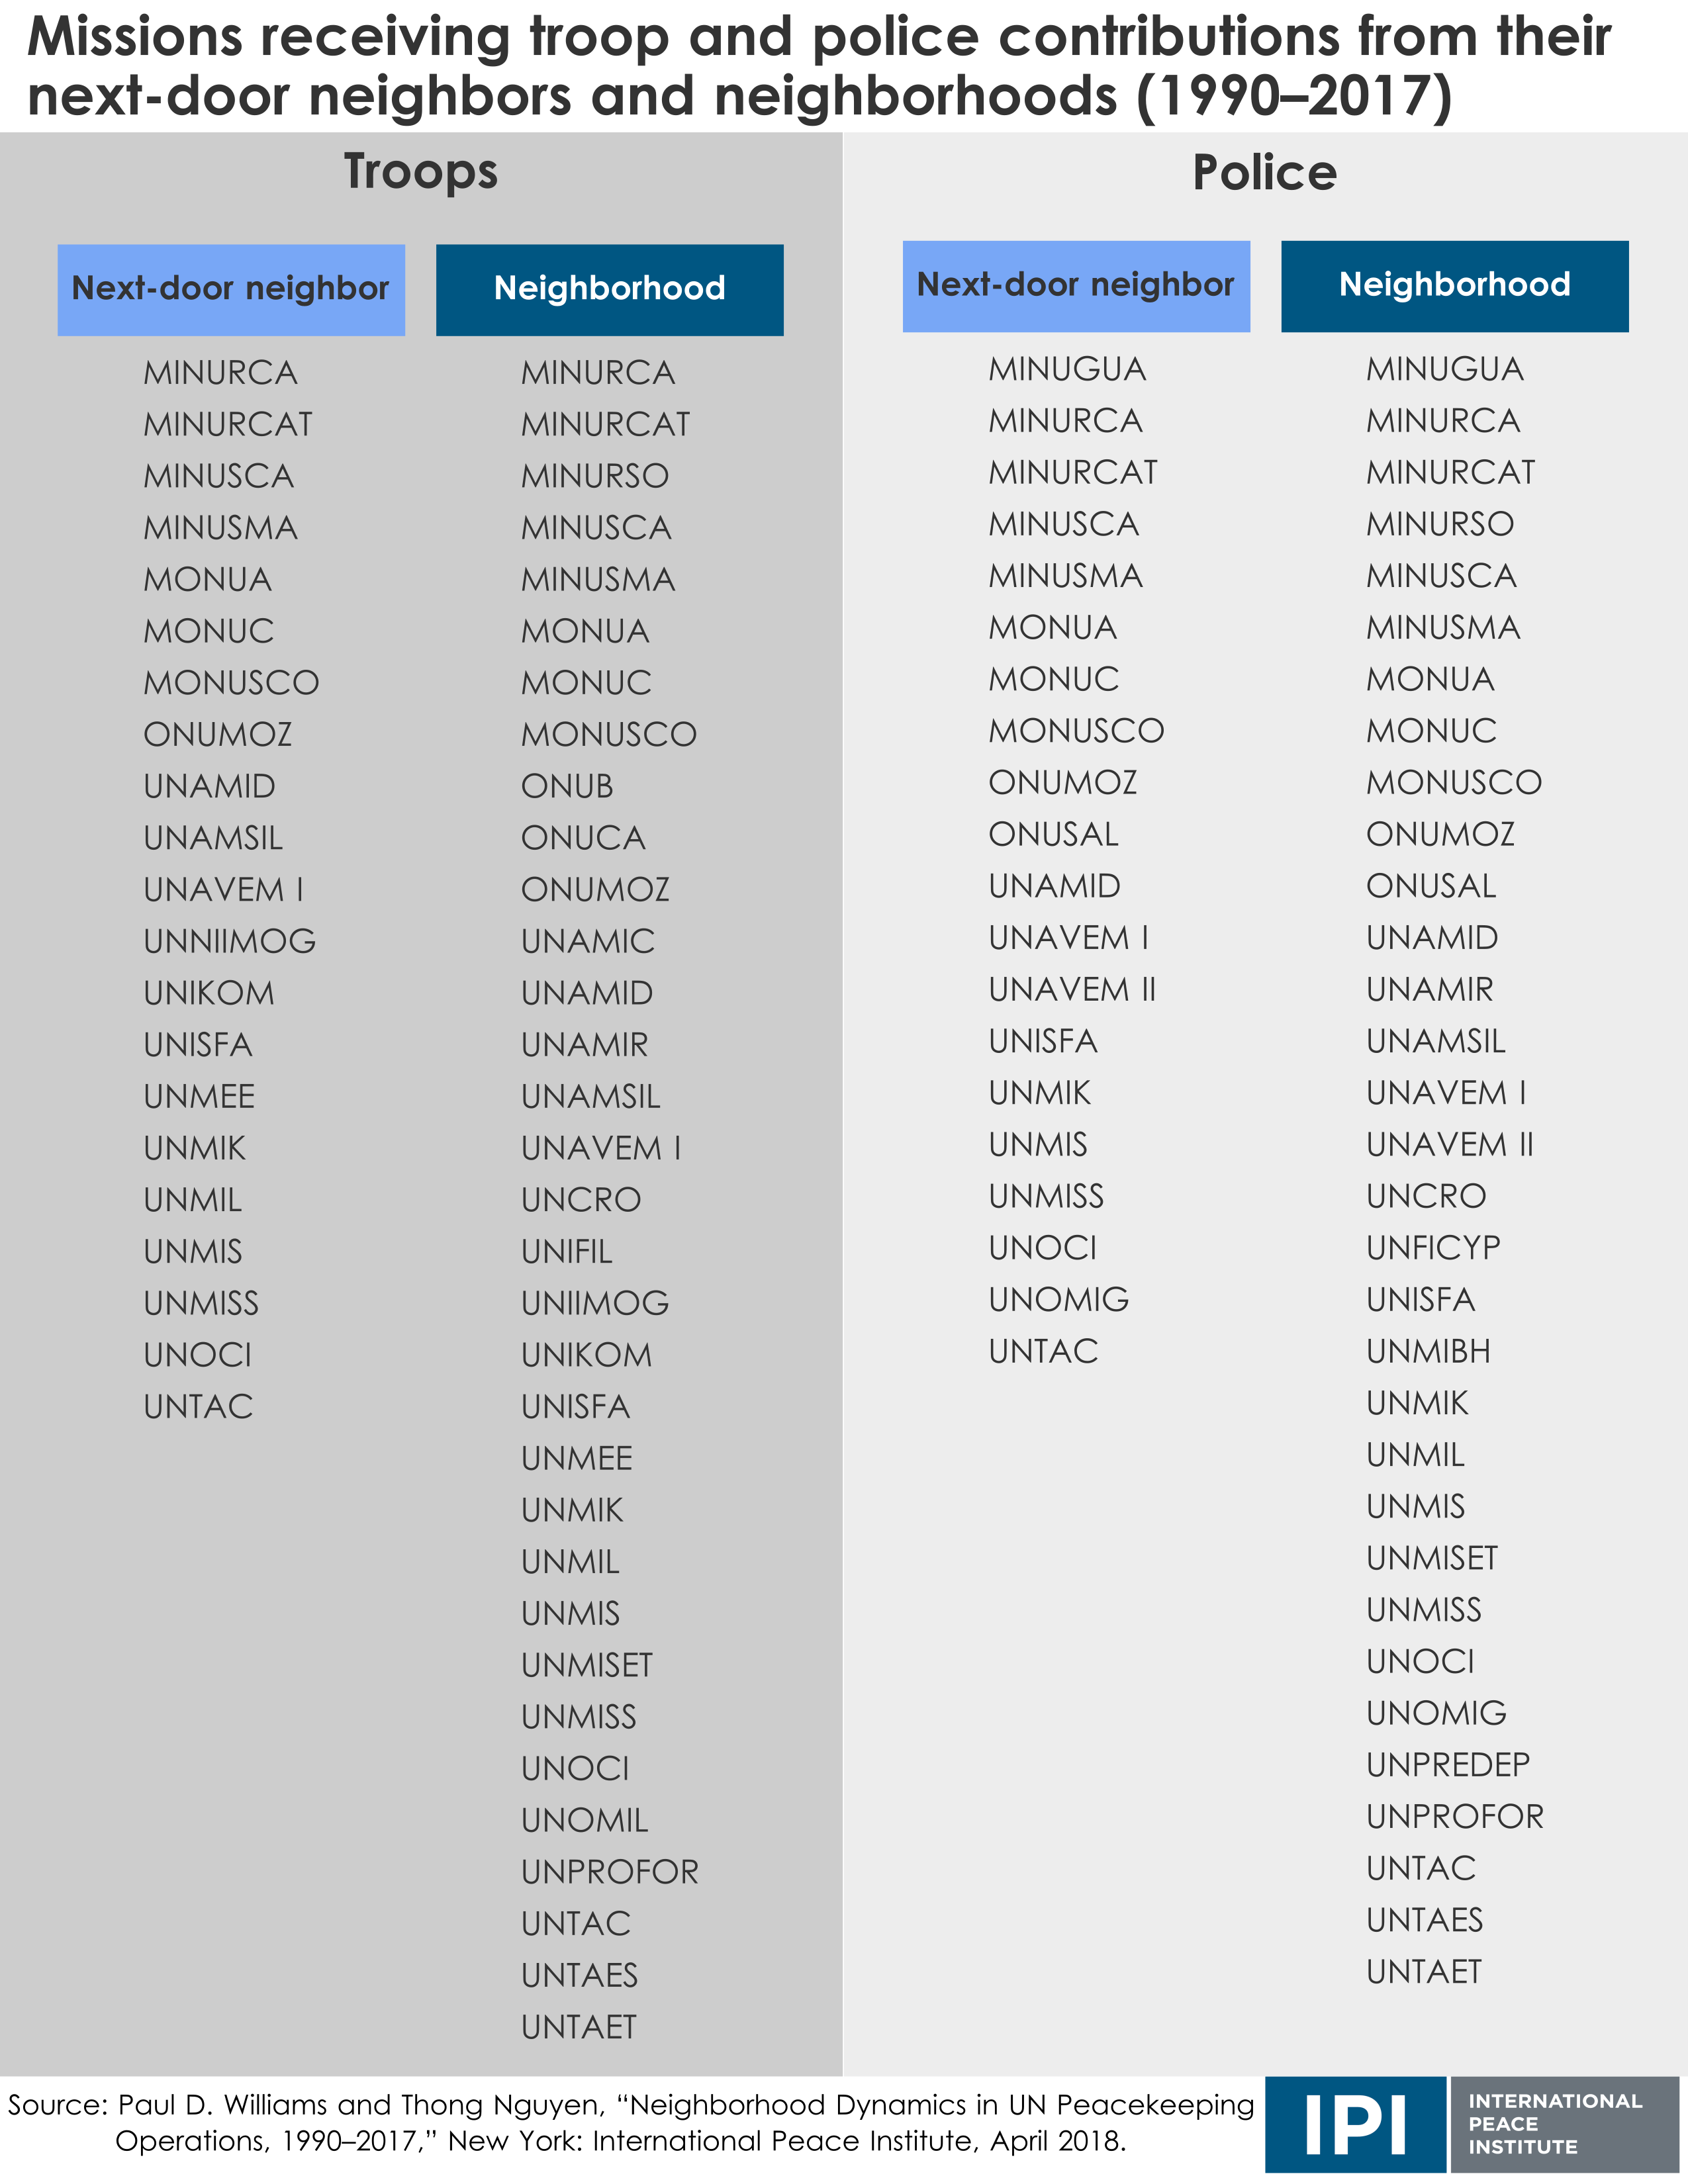
Missions receiving troop and police contributions from their next-door neighbors and neighborhoods
This chart lists the missions receiving contributions from their neighboring countries from 1990–2017.
|
Francophone Contributions to Missions in Francophone Countries
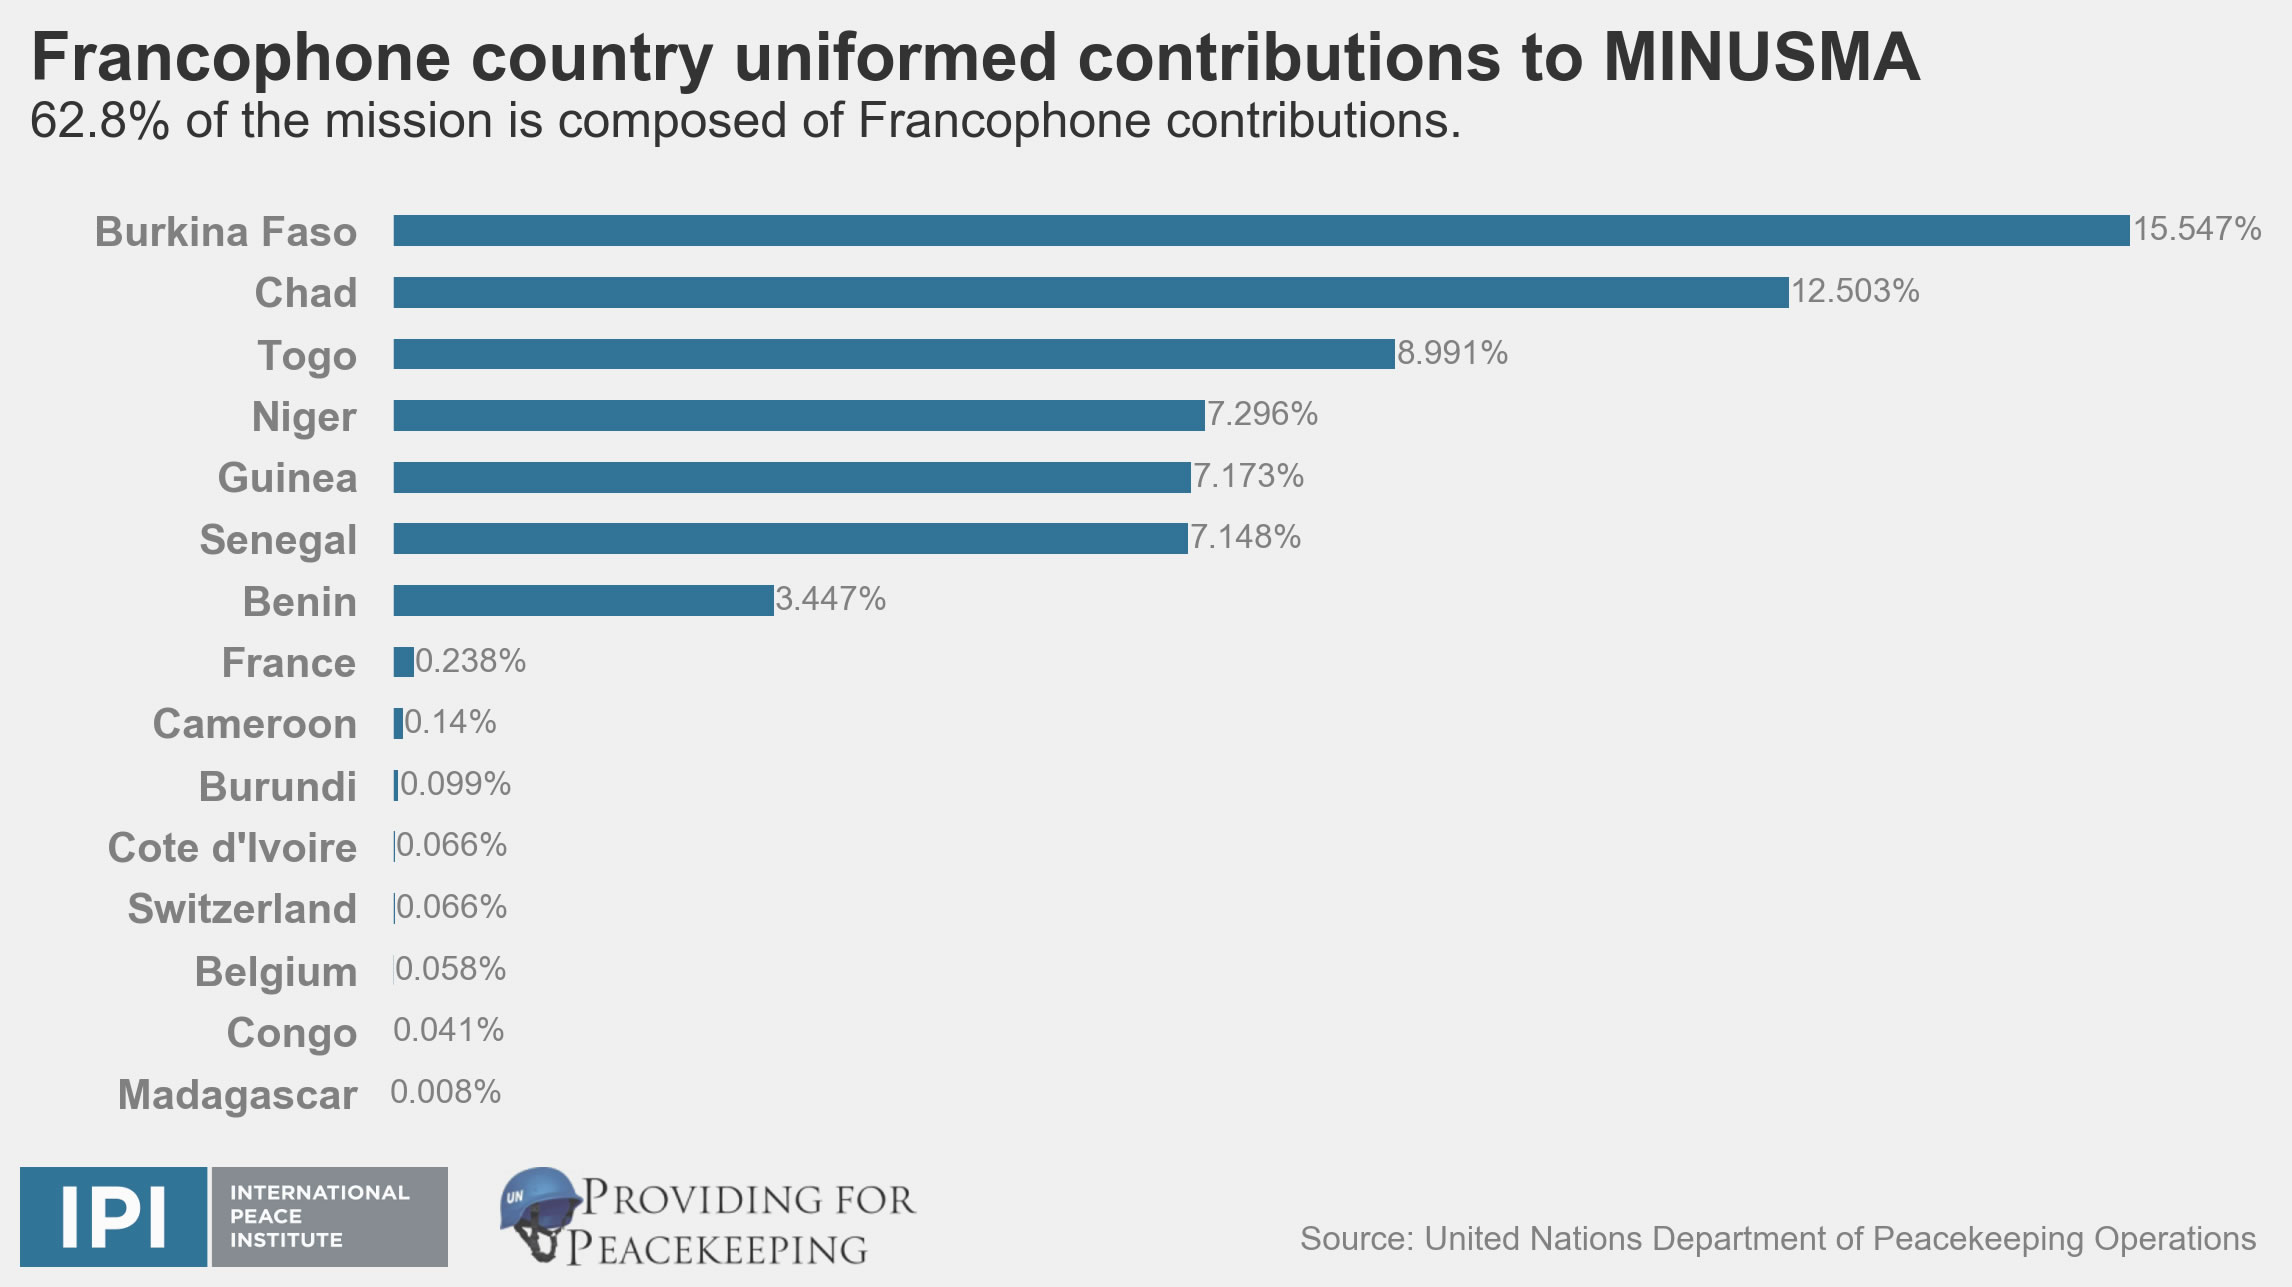
Francophone Contributions to MINUSMA
This graph shows Francophone contributions to MINUSMA as of December 2016. MINUSMA has the highest percentage of Francophone contributions to a mission in a Francophone country.
|

Francophone Contributions to MINUSCA
This graph shows Francophone contributions to MINUSCA as of December 2016.
|
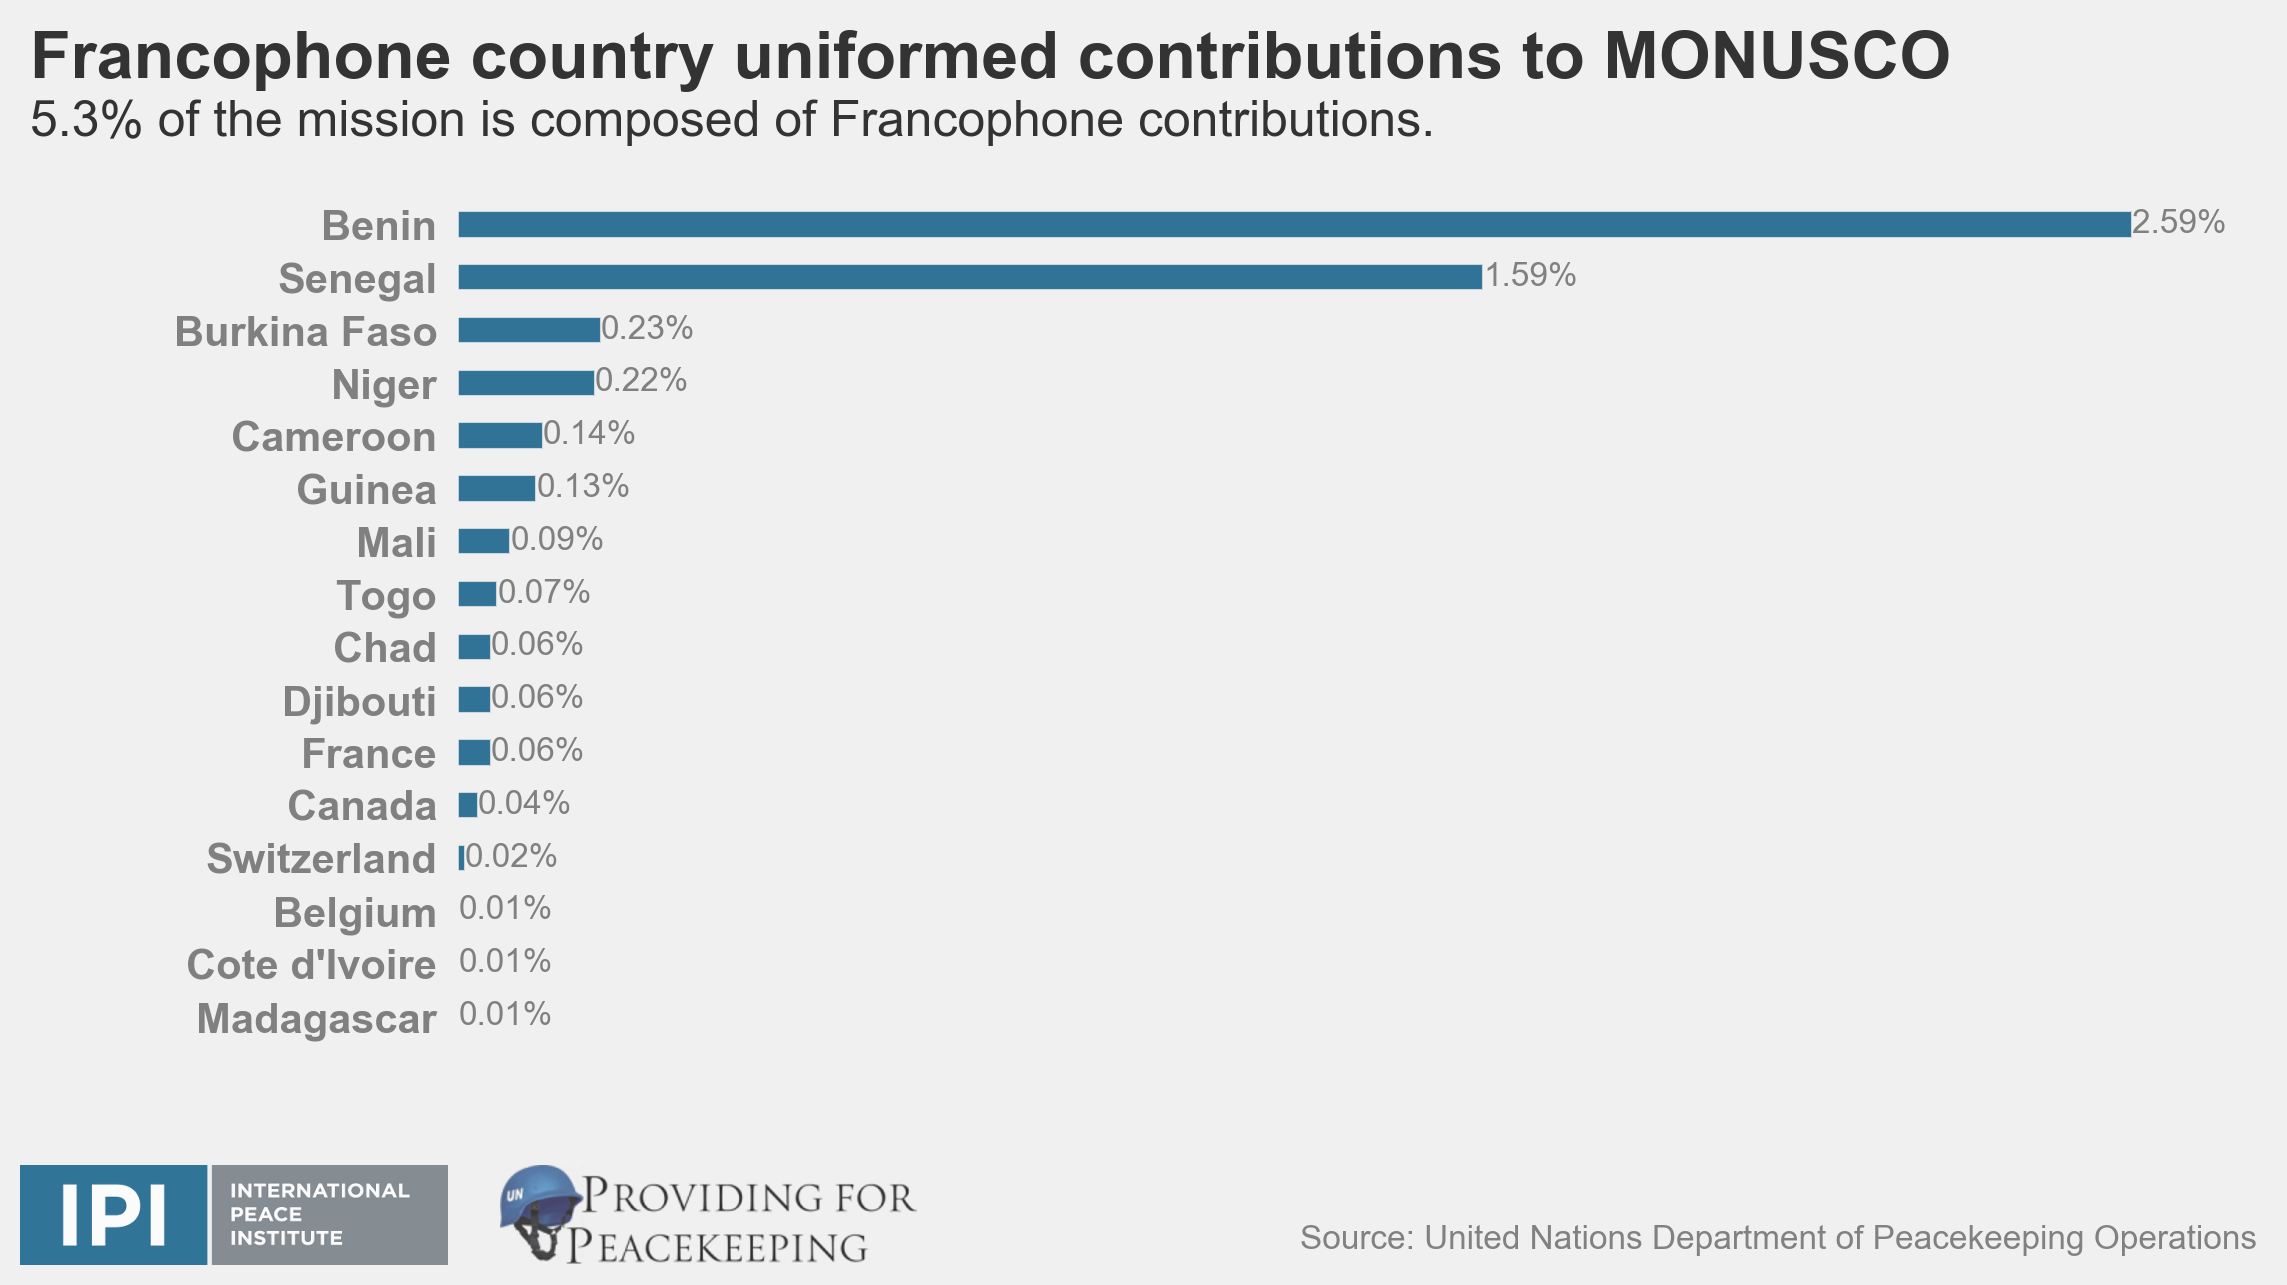
Francophone Contributions to MONUSCO
This graph shows Francophone contributions to MONUSCO as of December 2016.
|
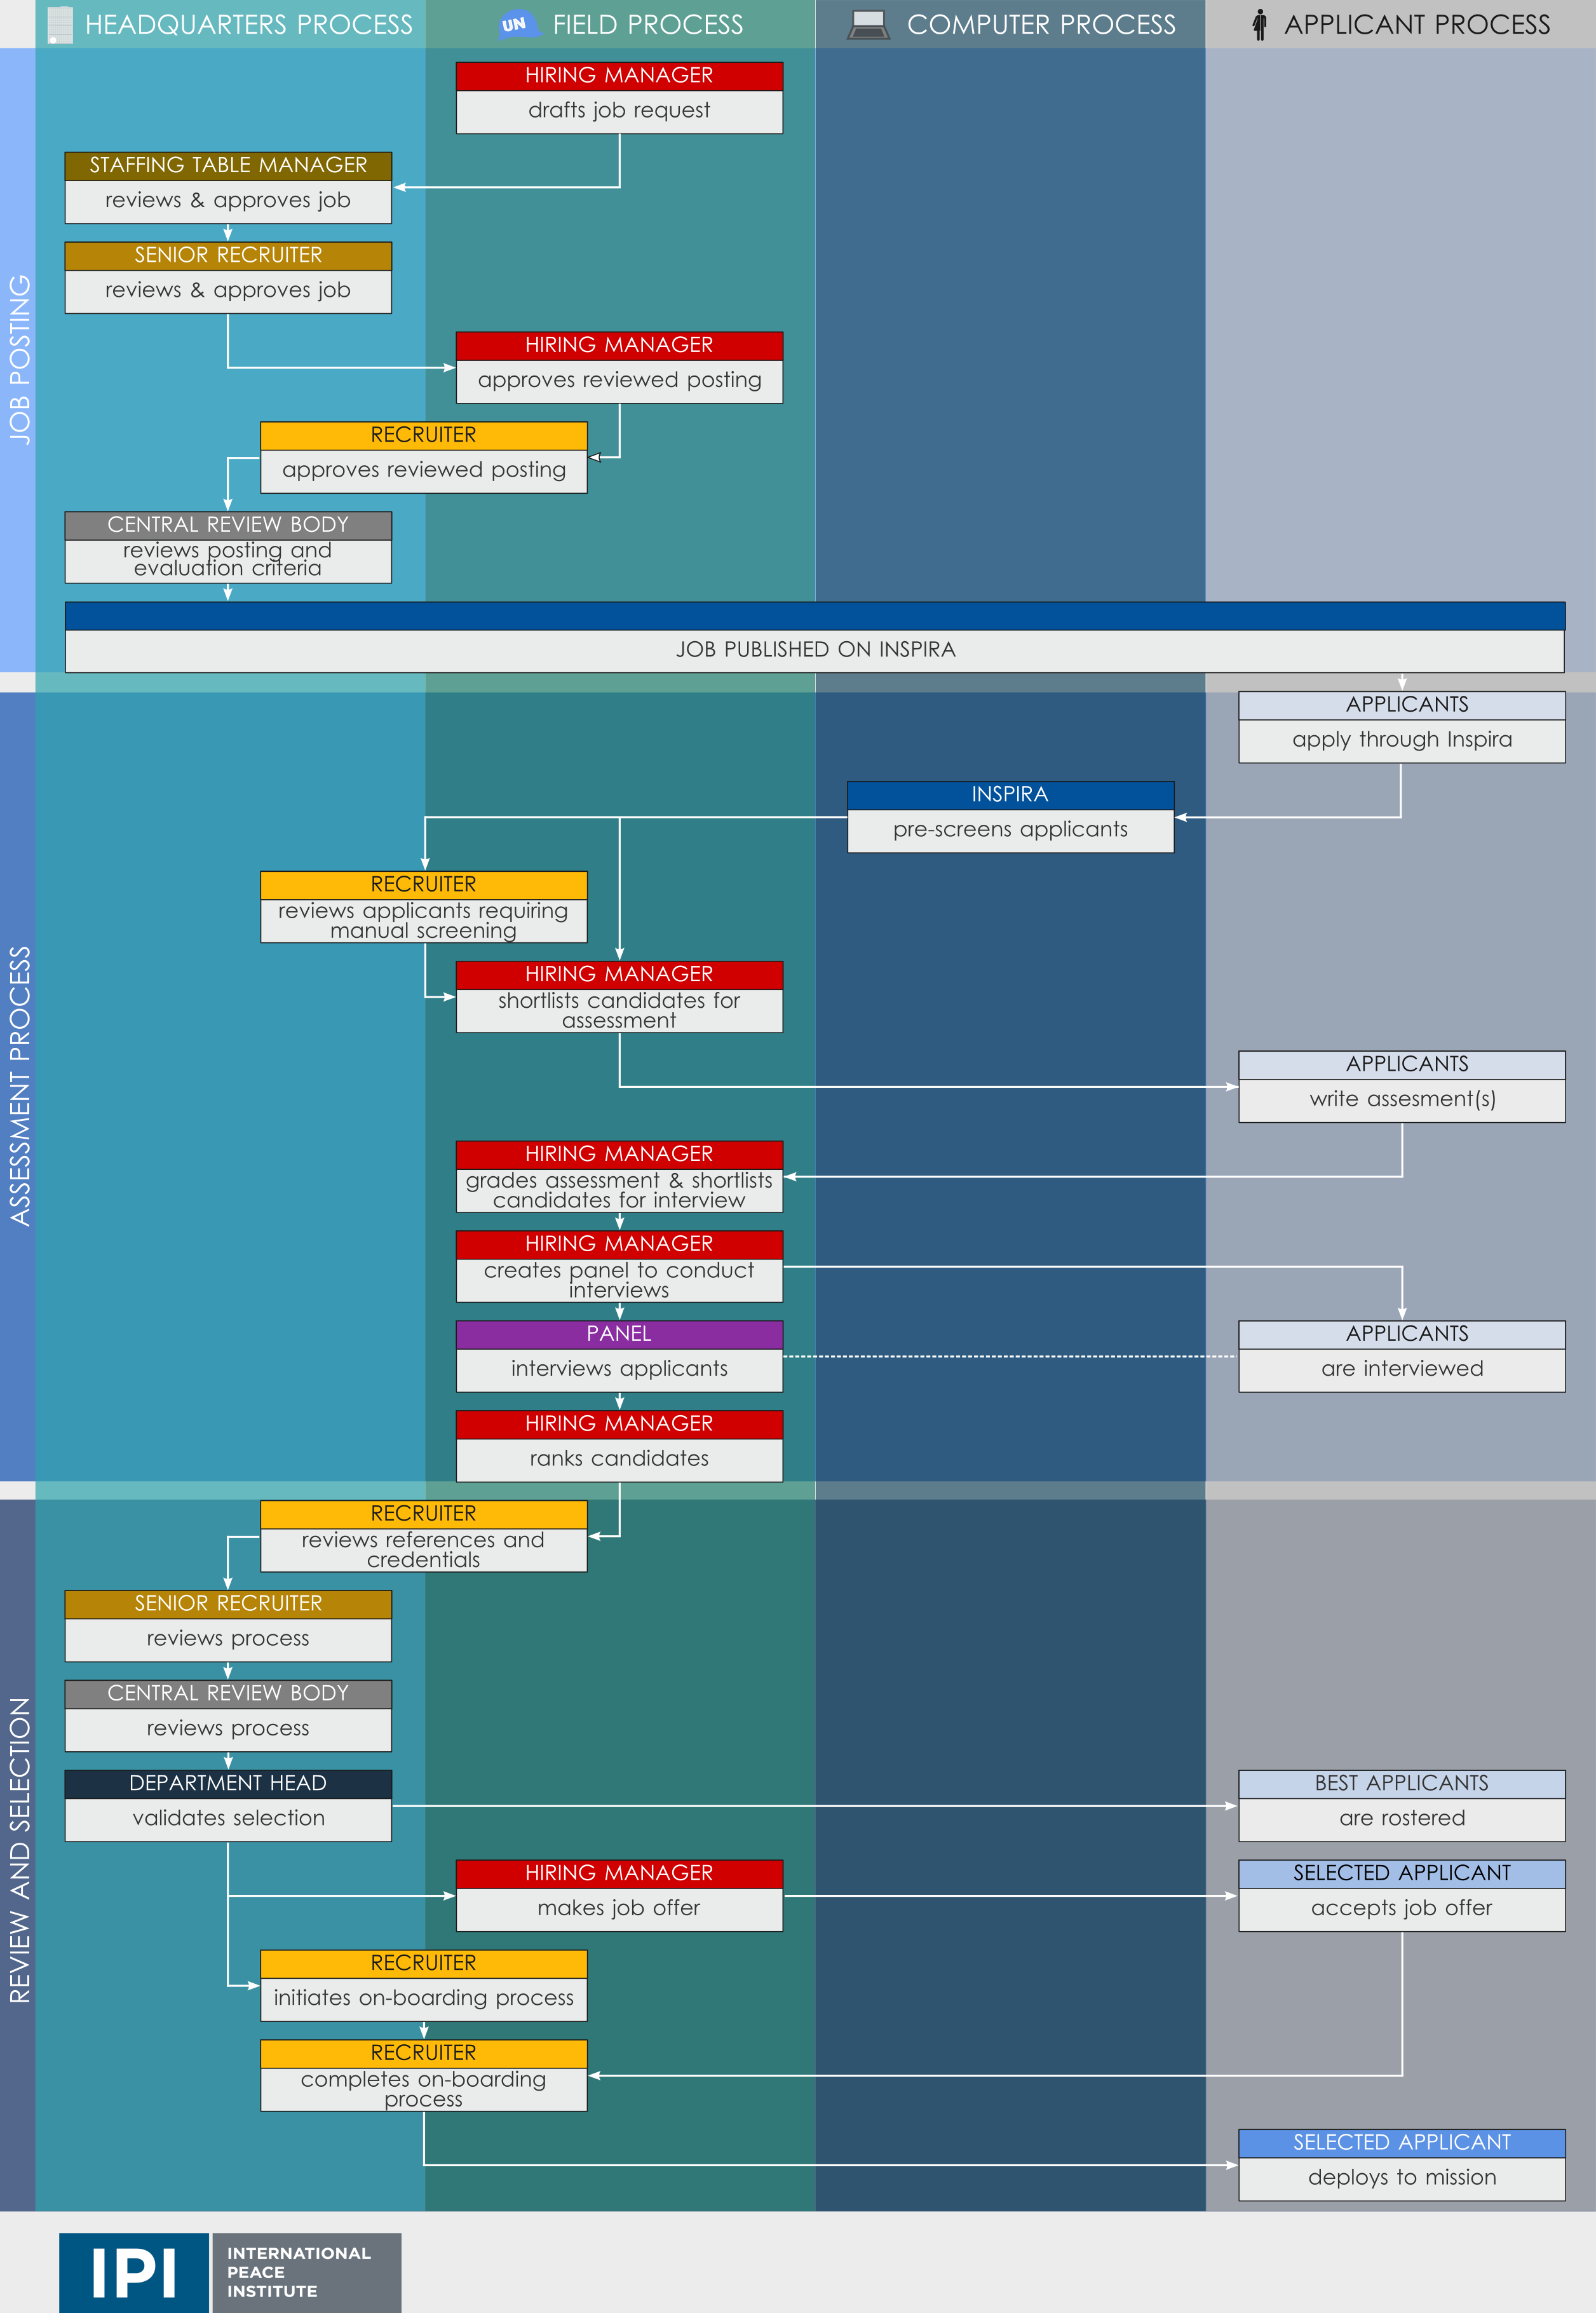
UN Recruitment Processes
The UN Recruitment Process
This Infographic shows the process, timeline and steps involved in the UN recruitment process. This image aims to portray the complexity of the process and highlight the lengthy timeline involved.